
Aquaculture Monitoring Dashboard
Understand aquaculture conditions to improve fish health and production efficiency.
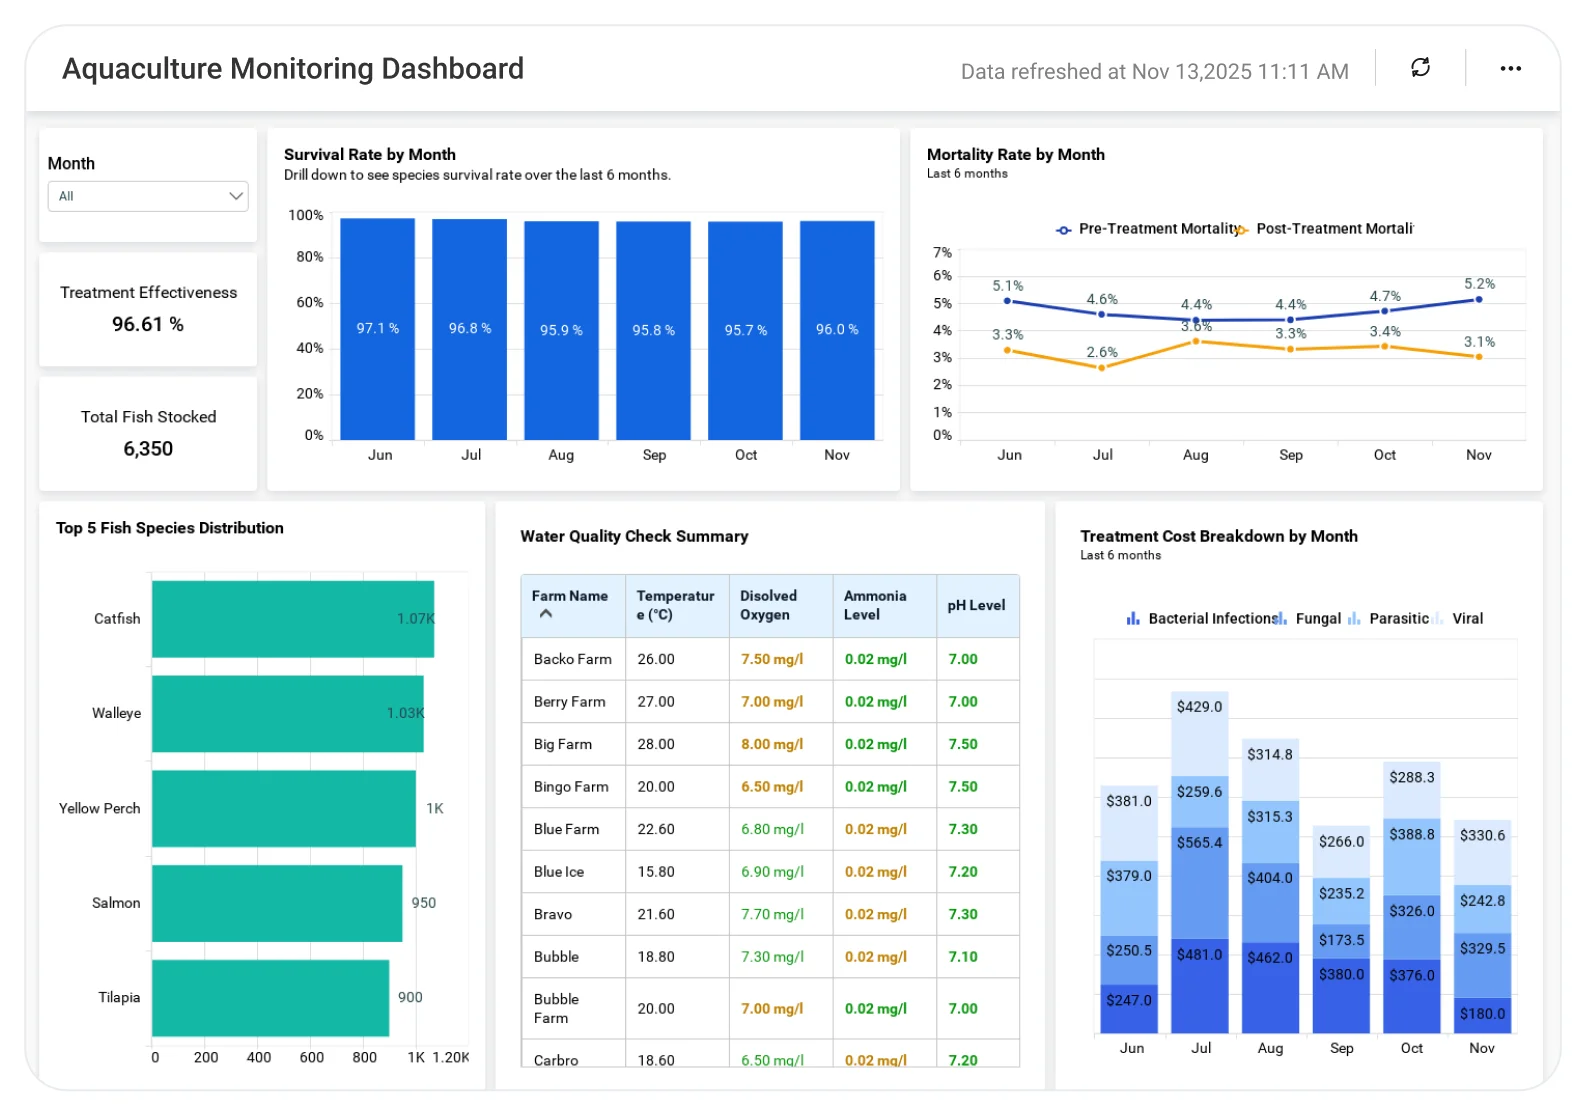
The Aquaculture Monitoring Dashboard helps farm operators analyze water quality, feeding patterns, growth indicators, and environmental conditions, enabling better farm management, reduced losses, and healthier aquaculture operations.
TL;DR
-
Monitor water quality, stock health, and production performance in one unified dashboard.
-
Detect early risks related to water conditions, feeding inefficiencies, or stock stress.
-
Track growth, biomass, mortality, and feed conversion trends across production cycles.
-
Compare performance across farms, ponds, tanks, or species to identify best practices.
-
Improve yield, reduce losses, and support sustainable aquaculture operations with data-driven insights.
What Is a Aquaculture Monitoring Dashboard?
An Aquaculture Monitoring Dashboard helps aquaculture teams track water quality, stock growth, feeding efficiency, and production performance in a single, consolidated view.
In Bold BI, this dashboard combines sensor data, farm records, and operational metrics to uncover patterns, anticipate risks, and support faster, data-backed decisions across aquaculture operations.
Why Aquaculture Monitoring Dashboard Matters
Aquaculture success depends on maintaining stable conditions and healthy stock throughout the production lifecycle.
When environmental data, feeding records, and production metrics are reviewed separately:
-
Early warning signs of stress or disease may be missed.
-
Feed inefficiencies increase operational costs.
-
Mortality trends surface too late.
-
Yield forecasting becomes unreliable.
A centralized analytics dashboard enables aquaculture teams to move from reactive responses to predictive, insight-driven farm management.
What You’ll Track
Using Bold BI dashboards, you will track important KPIs such as:
-
Water quality indicators: Temperature, pH, dissolved oxygen, and ammonia levels to assess conditions affecting stock health.
-
Stock health & growth trends: Biomass progression, survival rate, and mortality patterns across production cycles.
-
Feeding efficiency metrics: Feed consumption and feed conversion ratio (FCR) to evaluate feeding effectiveness and cost control.
-
Production performance analysis: Harvest yield, cycle duration, and output comparison across farms, ponds, or tanks.
All dashboards are fully customizable, allowing you to add KPIs or metrics as needed.
How It Works
-
Apply the Aquaculture Monitoring Dashboard sample.
-
Combine environmental, biological, and operational data in one unified view.
-
Analyze performance by farm, pond, species, or production cycle.
-
Share role-based dashboards with operations teams and leadership.
Why Bold BI Is the Right Fit for Aquaculture Monitoring Analytics
-
Unified data visibility: Bring sensor data, farm logs, and production records into a single analytics view.
-
Centralized performance analysis: Evaluate environmental conditions, feeding efficiency, and stock performance.
-
Comparative insights: Compare farms, ponds, or cycles to identify risks and best-performing practices.
-
Actionable drilldowns: Investigate growth issues, mortality spikes, or feed inefficiencies through interactive analysis.
-
Secure & compliant analytics: Protect operational data with Single Sign On(SSO), Role Based Access Control(RBAC), and Row Level Security(RLS).
-
Flexible deployment: Deploy dashboards in cloud or self-hosted environments to meet operational or regulatory needs.
Compare Options (at a glance)
| Feature | Bold BI | Farm System Reports | Spreadsheets |
| Cross-farm analytics | Yes | Limited | Manual |
| Environmental + production insights | Unified | Partial | No |
| Predictive trend analysis | Yes | Limited | No |
| Custom KPIs & drilldowns | Fully customizable | Fixed | Manual |
| Deployment options | Cloud / Self-hosted | SaaS only | Local |


