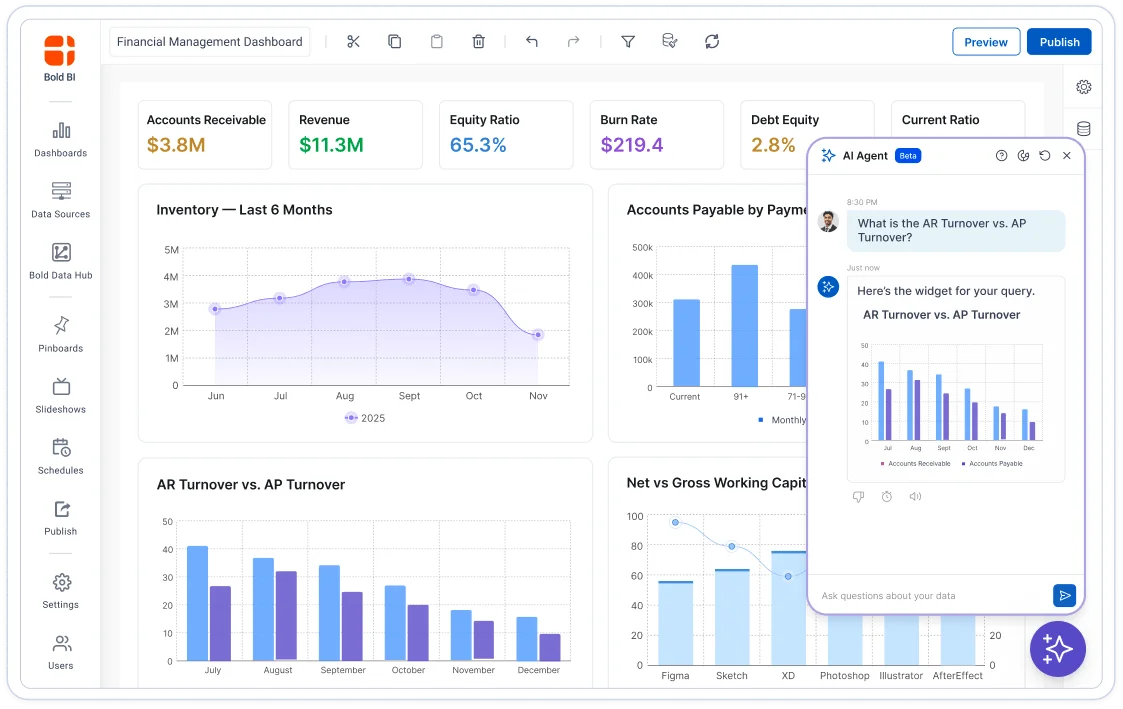
Ask Data in Plain English. Turn Questions Into Charts.
Type a question, and Bold BI turns it into a chart, a written explanation, or a full working dashboard — no SQL, no ticket to the data team. Use it standalone, or embed it directly in your own product.
No credit card required · No sales talk on the demo, just a product tour
-
G2 4.4/5 (91 reviews)
-
Capterra 4.9/5
-
140+ data connectors
Syscon
NetWorxc
A4B
DigiQuip
CarNow
Revver
Smartway2
GeniusVets
Talentegy
The dashboard was never the bottleneck. The question was.
Building a dashboard takes an afternoon. Turning "why did signups drop in the Midwest" into a query and a chart takes three days — and most "AI analytics" tools stop right there, at one chart. Here's where that breaks down, and what Bold BI does instead.
| Where it breaks down | What Bold BI does instead |
|---|---|
| Business users wait on analysts or IT for answers that should take seconds. | Ask the AI Assistant directly, in plain English, and get the chart and a written explanation back immediately — no ticket, no queue. |
| Data teams field the same question five different ways from five different people. | Synonym Support resolves "revenue," "net rev," and "sales" to the same field, so people ask it themselves instead of routing every phrasing through the one person who knows the schema. |
| Engineering teams get asked to bolt AI onto existing dashboards, on top of everything else they're shipping. | Bold BI's AI ships through the same SDK and REST API used to embed the rest of the platform — a few calls to a feature that already exists, not a separate AI project competing for the same sprint. |
| Whoever approves the budget is nervous about what "AI-powered" is going to cost once usage scales. | AI capability is included in an application-based license, not billed per seat or per query — and BYOK lets you connect and pay for your own model provider directly. |
Every claim above, mapped to a shipped feature.
Not a roadmap item — available today.Four things it handles inside the Designer — building visuals, editing them by description, holding context across a thread, and reading your schema for business terms.
AI Assistant
A single conversational interface across your dashboards and data. Ask a question about trends, comparisons, or outliers in plain language and get an answer, not a query to write.
AI Copilot (Dashboard Designer)
Builds and adjusts visuals — chart type, colors, labels — from a typed description instead of a settings menu.
AI Agent (Dashboard Viewer)
Ask follow-up questions about trends and patterns directly inside a live dashboard, and get a contextual answer without leaving the view.
Prompt-to-Dashboard
Converts one typed request into a fully built, interactive dashboard — no manual setup, no starting from a blank canvas.
Smart Narrations
Auto-generated, plain-language summaries attached to every dashboard, calling out the trends and outliers a busy reader would otherwise have to find manually.
Synonym Support
Recognizes the business term someone actually types ("revenue") even when the underlying field is named something else, and maps it automatically.
SDK / REST API embedding
Every AI feature ships through the same JavaScript SDK and REST API (React, Angular, Vue, .NET, Blazor) used to embed the rest of Bold BI.
Application-based pricing
AI capability is included in the platform license. Adding users doesn't add a per-seat or per-query AI charge.
AI Credits Management
One place for admins to monitor and manage AI usage across teams — visibility instead of a surprise line item.
Bring Your Own Key (BYOK)
Connect your own OpenAI, Azure OpenAI, or Anthropic credentials, so you control the model and the billing relationship directly.
From question to dashboard in four steps.
No manual build step in between — connect, ask, and the dashboard is already there.
Connect your data
140+ connectors across databases, cloud warehouses, REST APIs, and files — cloud, on-premises, Docker, or Kubernetes.
Ask, or type a prompt
Explore data without SQL: ask a question in the AI Assistant, or describe the dashboard you want with Prompt-to-Dashboard.
Get the answer instantly
AI-generated charts, a written Smart Narration, and a full working dashboard if you asked for one — no manual build step.
Use it standalone or embed it
Share it as a Bold BI dashboard, or drop it into your own product with the SDK, carrying your branding, SSO, and role-based security with it.
Whichever seat you're in, this is for you.
Four teams, four different reasons to switch on AI analytics. Pick yours.
Product & Engineering Teams Embedding Analytics
Add AI-generated insights to your own application through the SDK and REST API, white-labeled and governed by the same SSO and row-level security as everything else you embed.
Data Scientists & AI/ML Teams
Bring your own model through BYOK (OpenAI, Azure OpenAI, Anthropic), connect to the warehouse you already run, and keep AI usage visible and governable through AI Credits Management.
Digital Transformation & Innovation Leaders
Get a working AI analytics rollout in weeks through a 30-day trial, not a multi-quarter build, on pricing that's set by application rather than by every new user you add.
Non-Technical Business Users
Ask a question the way you'd ask a colleague. No dashboard training, no SQL, no waiting for someone else to pull the number.
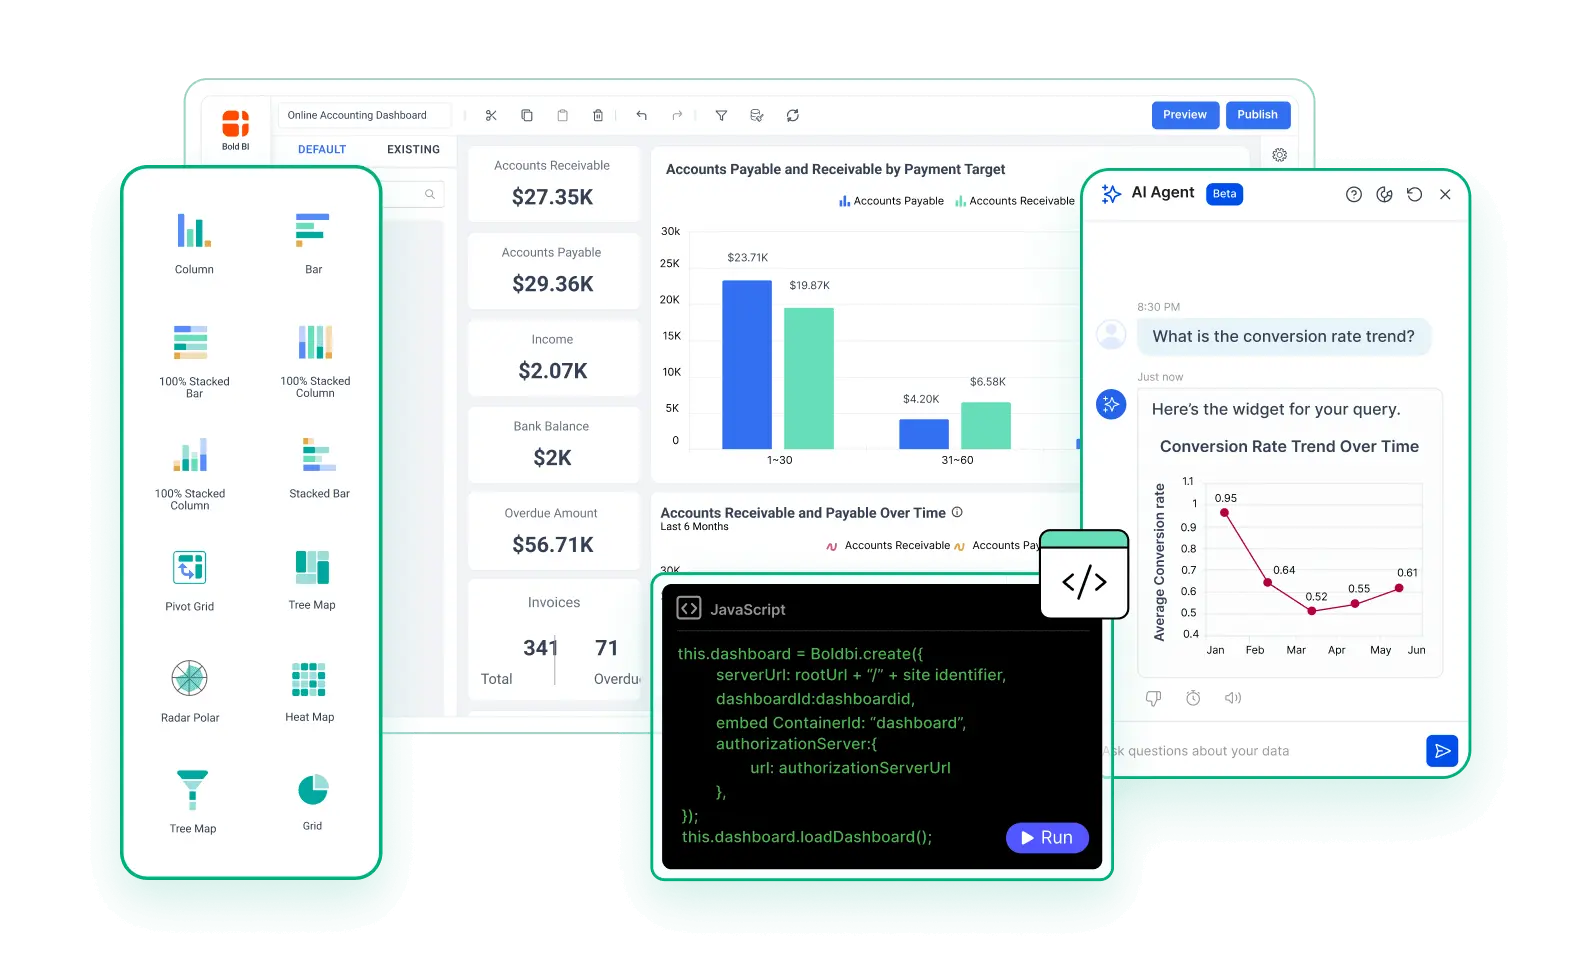
Same governance as the rest of Bold BI.
AI features run under the same governance as the rest of Bold BI — nothing about "AI-powered" loosens the security model.
| AI Without Bold BI | AI With Bold BI |
|---|---|
| What reaches the AI model | Table and column names as context. Raw data rows never leave for the language model. |
| Who owns the AI provider | BYOK — connect your own OpenAI, Azure OpenAI, or Anthropic credentials. |
| Access control | SSO (OAuth, SAML), row-level security, and audit logs per user and per tenant. |
| Compliance | ISO 27001 certified; SOC 2 Type II, GDPR, and HIPAA compliant. |
| Deployment | Cloud, on-premises, Docker, or Kubernetes, in AWS, Azure, or GCP — the same AI feature set either way. |
Real feedback, real deployments.
Recognized by G2, TrustRadius and Visual Studio Magazine for delivering standout performance and value.
"Now I can basically provide anything the customer needs from their dashboard, and I really don't have limitations. I can customize anything."
PH
Pedro Hernandez
Peopleworks
"White-labeling and SSO (OAuth/SAML) made the UX feel truly 'ours,' and support has been responsive when we needed help."
NK
Nirbhay K
G2 review
Common questions, answered directly.
Objection-handling first, feature curiosity second.
Table and column names, used as context for the AI query. Raw data rows are never sent to the underlying language model.
Yes. Role-based access, SSO, and audit logging apply to AI features exactly as they do everywhere else in Bold BI. The platform is ISO 27001 certified and SOC 2 Type II, GDPR, and HIPAA compliant.
No. The AI Assistant and Prompt-to-Dashboard both work from a plain-English question or request — Bold BI maps it to the right data using the AI Assistant's synonym support.
It's part of the platform: AI Copilot in the dashboard designer, the AI Agent in the dashboard viewer, and the AI Assistant are included, not a separate tool you buy or log into elsewhere.
Bold BI is licensed by application rather than per user or per query. AI Credits Management gives admins visibility into AI consumption across the organization, and BYOK lets you connect and pay for your own model provider directly if you'd rather manage that relationship yourself.
Bring Your Own Key support covers OpenAI, Azure OpenAI, and Anthropic, so you can use the provider and credentials you already have in place.
Yes. AI-generated dashboards and insights are available through the same JavaScript SDK and REST API used for embedding the rest of Bold BI, with your white-labeling, SSO, and row-level security carried through.
Yes — 30 days, full features, no credit card required.
Schedule a live demo and bring a real question you want answered; that's a faster gut check than reading a spec sheet.
See your own dashboard, embedded in your own app, before you commit to anything.
Connect a real data source, build the dashboard your team actually needs, and embed it with your own branding — all inside a 30-day trial.