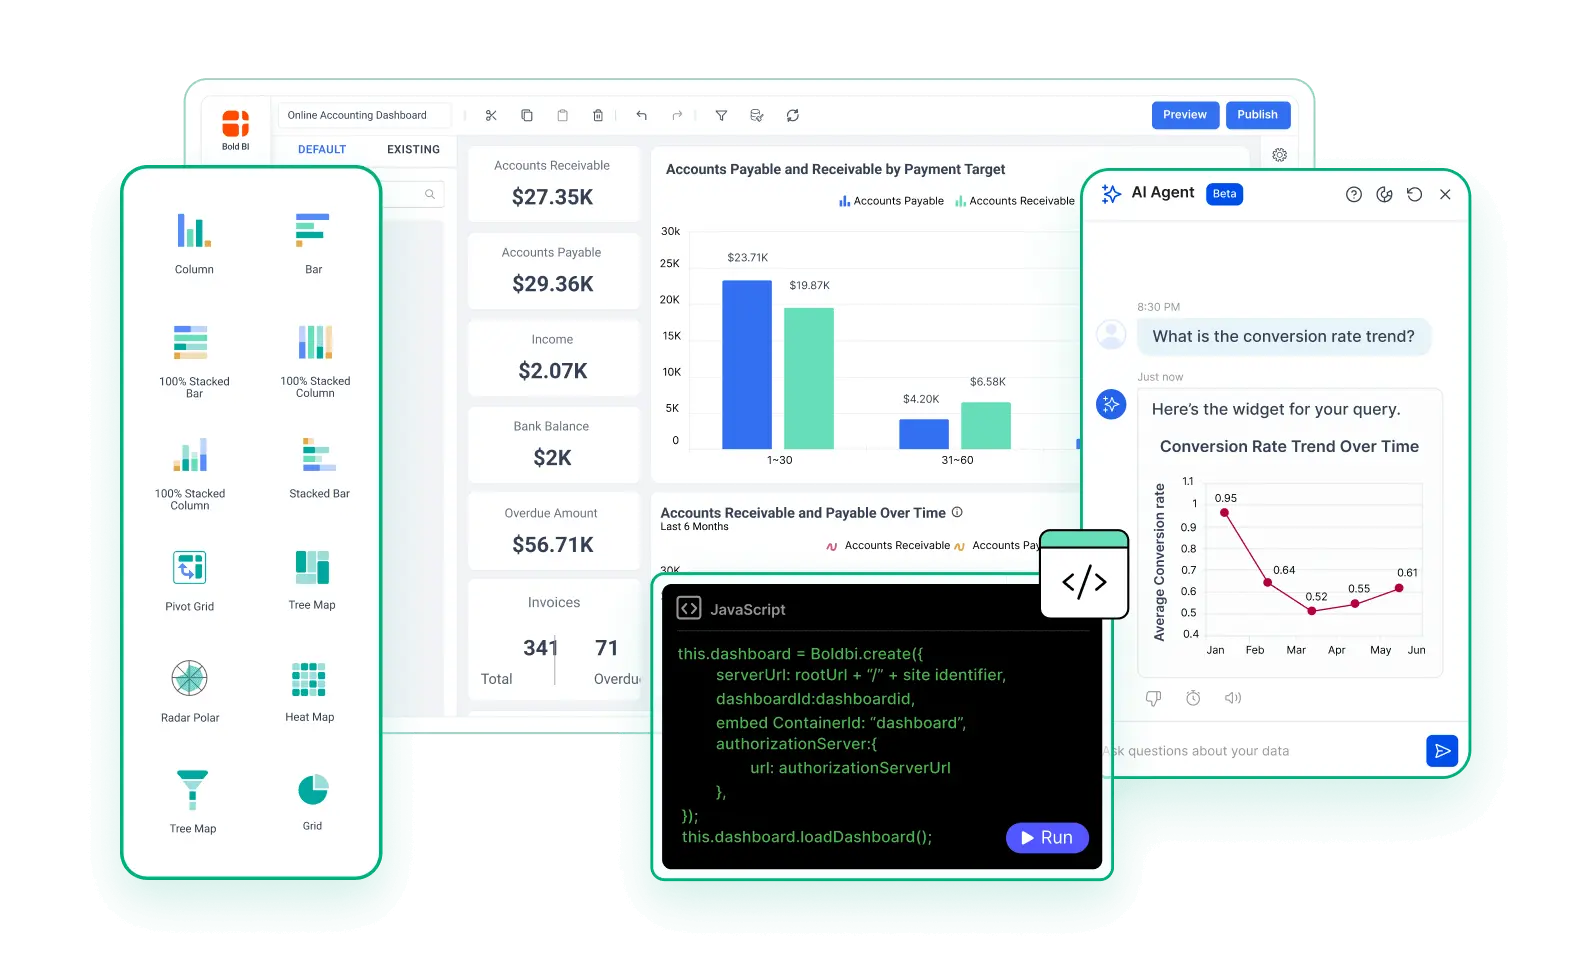
Interactive dashboard tools for business users
Stop waiting on IT for every report change. Bold BI turns raw, scattered data into dashboards your whole team can build, explore, and drill into — no development effort, no per-user licensing.

Syscon
NetWorxc
A4B
DigiQuip
CarNow
Revver
Smartway2
GeniusVets
Talentegy
Your team shouldn't need a developer to ask a question of their data
Bold BI is built to close that gap — dashboards your business teams can create and explore themselves, backed by governance your IT and data teams still control.
Operations managers wait days for a report change.
Sales leaders export spreadsheets to answer one question.
Finance reconciles numbers across four disconnected tools before a board meeting.
IT ends up owning every dashboard request — self-service BI never actually became self-service.
One platform. Four reasons it replaces the spreadsheet-and-ticket workflow.
Every team on this page is dealing with the same root problem — data that's too slow, too locked-down, or too scattered to act on. Here's how Bold BI addresses each part of it.
Create rich interactive dashboards without development effort
Drag-and-drop widgets, prebuilt visualizations, and a designer built for business users — not just engineers. Ship a working dashboard in hours instead of routing a ticket to your dev team.
Analyze data faster with drill-down and self-service exploration
Click into any chart to filter, drill down, and cross-highlight related data instantly. Get answers to follow-up questions without opening a new request.
Track real-time business performance from a single view
Live-connected dashboards keep KPIs current automatically, so every team is working from the same numbers — not last week's export.
Connect and visualize data from 100+ enterprise sources
Native connectors for databases, cloud warehouses, SaaS apps, and flat files — centralize reporting without building custom pipelines.
Create dashboards with AI
Describe what you want to see and Bold BI's AI assistant generates the visualization, suggests the right chart type, and surfaces anomalies you'd otherwise have to go looking for.
Which regions are trending under target this quarter?
EMEA is 11% under target and LATAM is 4% under. Here's a ranked bar chart with the gap for each region.
Gap to plan by region
EMEA
-11%
LATAM
-4%
NA
+3%
Chart suggestion
The AI picks the right chart type for your data — no configuration.
Anomaly surfacing
Spot outliers you'd otherwise have to go looking for.
First-draft dashboards
A starting point for business users, a shortcut for analysts
Drill-down stays yours
AI drafts it — your team still controls the exploration.
How it works
Four steps take you from a disconnected data source to a live dashboard your team can act on — no separate dev project required.
Connect
Link your databases, warehouses, and SaaS tools using one of 140+ built-in connectors. No custom integration work required.
Build
Drag prebuilt visualizations onto the canvas or let AI generate a first draft. Arrange KPIs, charts, and filters into a dashboard your team actually reads.
Explore
Filter, drill into, and cross-highlight data live — every viewer can ask their own follow-up question without waiting on a report update.
Share & govern
Publish dashboards to the teams that need them, with role-based access so IT keeps control of what's exposed.
Built for every data-dependent team
Select a team to see why self-service dashboards save them time.

Operations Managers
Track process and performance KPIs in one live view instead of stitching together weekly status reports.

Sales & Marketing
Filter pipeline, campaign, and funnel data on the fly without asking analytics for a custom pull.

Finance & Revenue
Reconcile and present revenue metrics from a single, always-current dashboard.

Enterprise Analytics
Scale dashboard creation across the business without becoming the bottleneck for every request.

IT & Data Teams
Centralize data access and governance while letting business users self-serve safely.
Straight answers before you trial or demo
No. The dashboard designer is built for business users — drag-and-drop widgets, prebuilt chart types, and an AI assistant that can generate a first draft for you. Development teams can extend it further with embedding and APIs when needed.
Most BI platforms charge per user, which gets expensive as you add viewers. Bold BI is priced by application, so you can scale the number of people using it without scaling the bill per seat.
140+ native connectors covering databases, cloud data warehouses, SaaS applications, and flat files — no custom pipeline required for most sources.
Yes. Self-service exploration for business users runs alongside role-based access controls, so IT and data teams retain control over what's published and who can see it.
You get full platform access during the trial. Talk to the team about application-based pricing before you're asked to commit to anything.
Build your first interactive dashboard today
Connect a data source, drop in a few widgets, and see how fast your team gets from raw data to an answer — free for 30 days.