
Data visualization platform built for business teams
Connect your data, build interactive dashboards, and see what's happening in your business in real time — without writing a query or filing an IT ticket.
No credit card required
Syscon
NetWorxc
A4B
DigiQuip
CarNow
Revver
Smartway2
GeniusVets
Talentegy
4.4/5
Average rating on G2 — 91 reviews
4.9/5
On Capterra, GetApp and Software Advice
140+
Data connectors, 40+ visualization types
G2 Leader
Fall 2025 · Top 50 Analytics Product (#29) · Easiest Admin
Your data isn't the problem. Getting it into a dashboard is.
One connection powers every dashboard downstream — drag-and-drop for business users, SDK for developers, no per-seat bill.
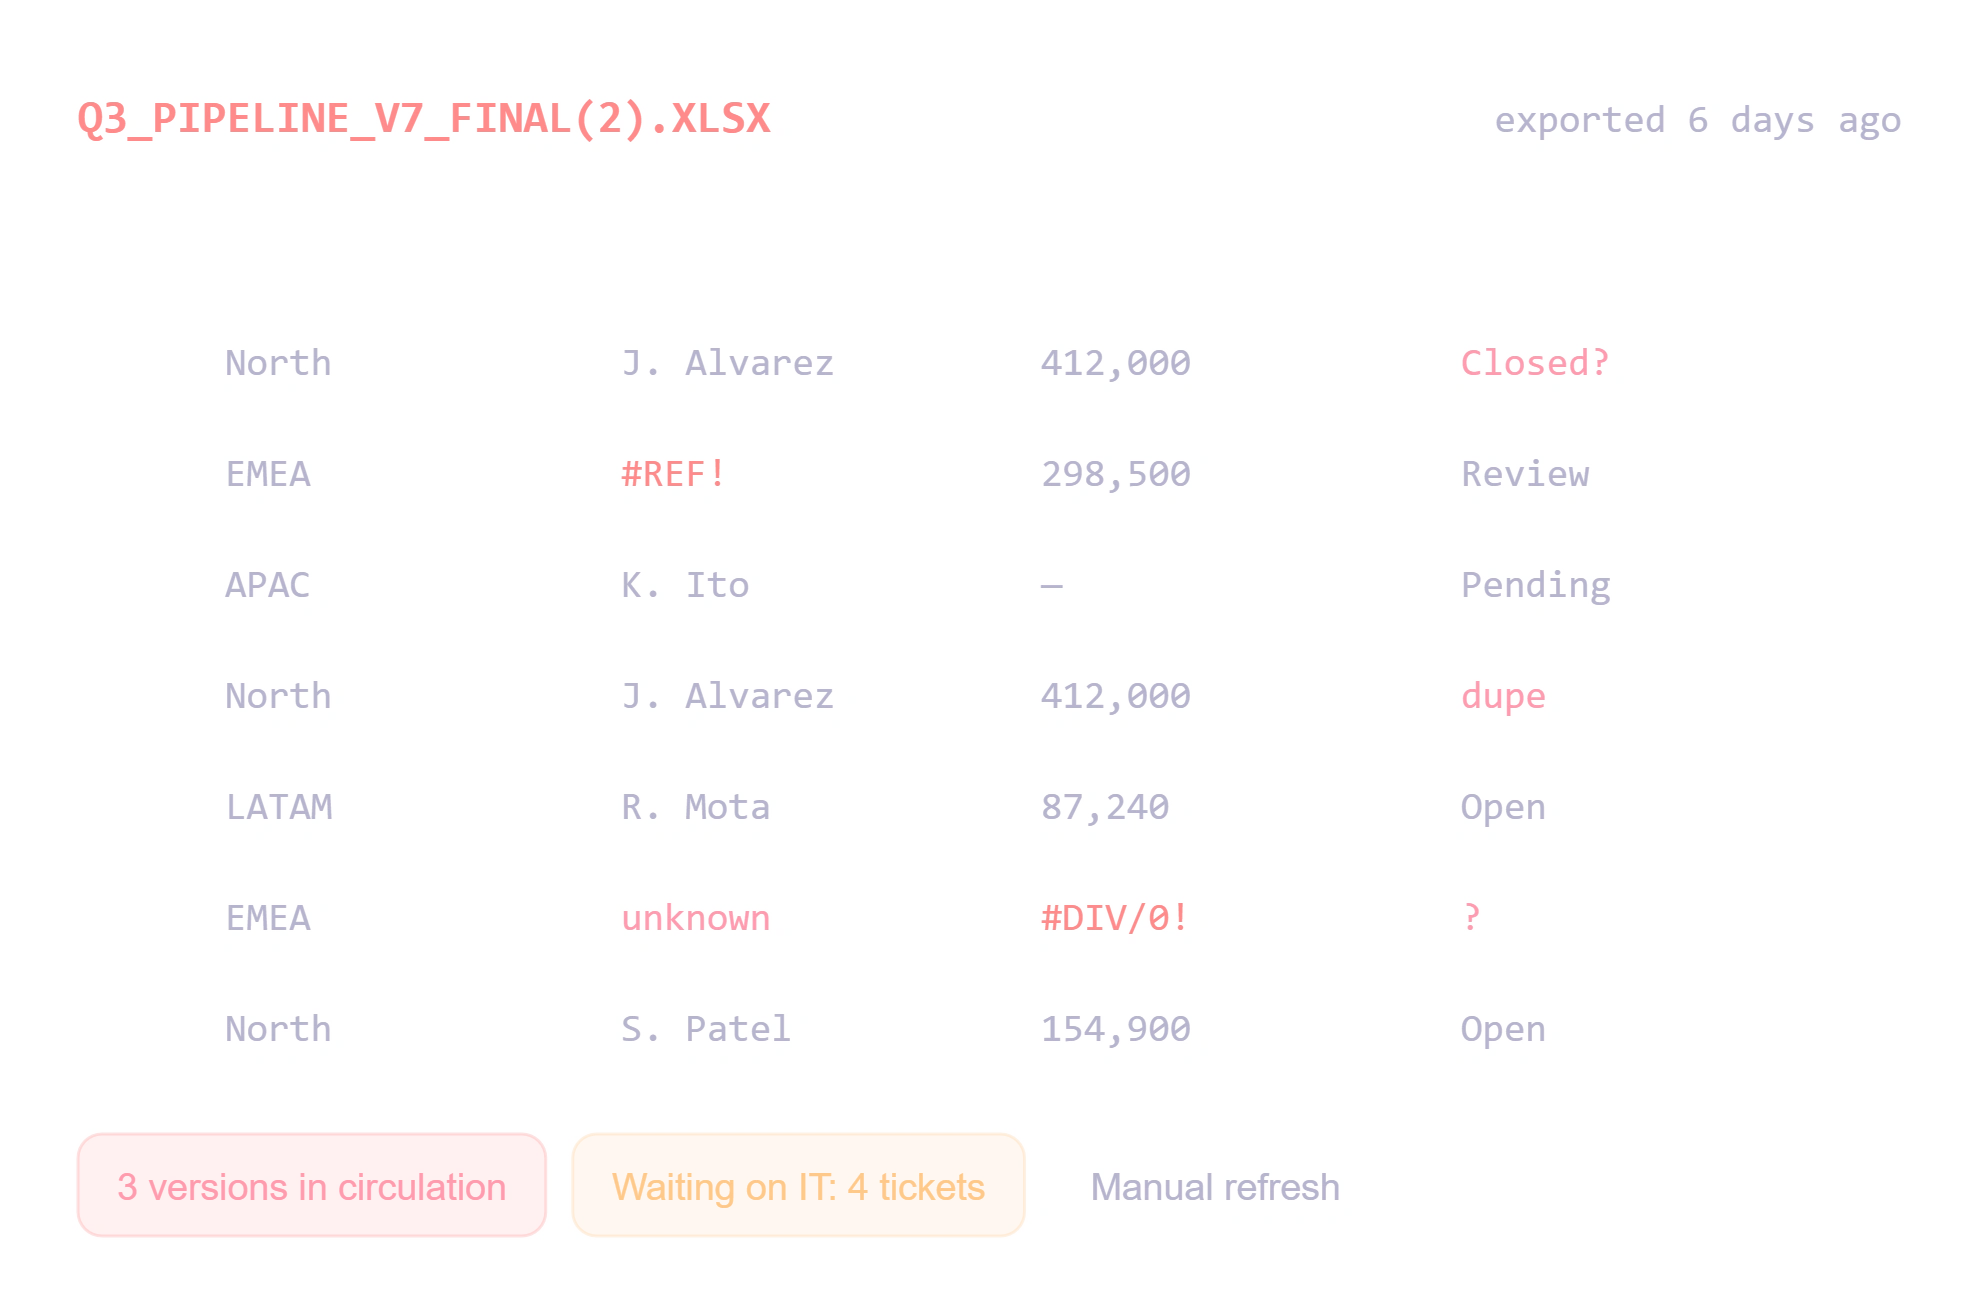
Most teams don't lack data — they lack a fast way to see it. Numbers sit scattered across spreadsheets, CRMs, and internal systems. Every new chart means exporting a CSV, pinging a developer, or waiting on whoever owns the "reporting tool." By the time a dashboard is ready, the decision it was supposed to inform has already been made without it.
-
One connection, every dashboard downstream stays live
-
Drag-and-drop for business users, SDK for developers
-
Application-based pricing — viewers don't move the bill
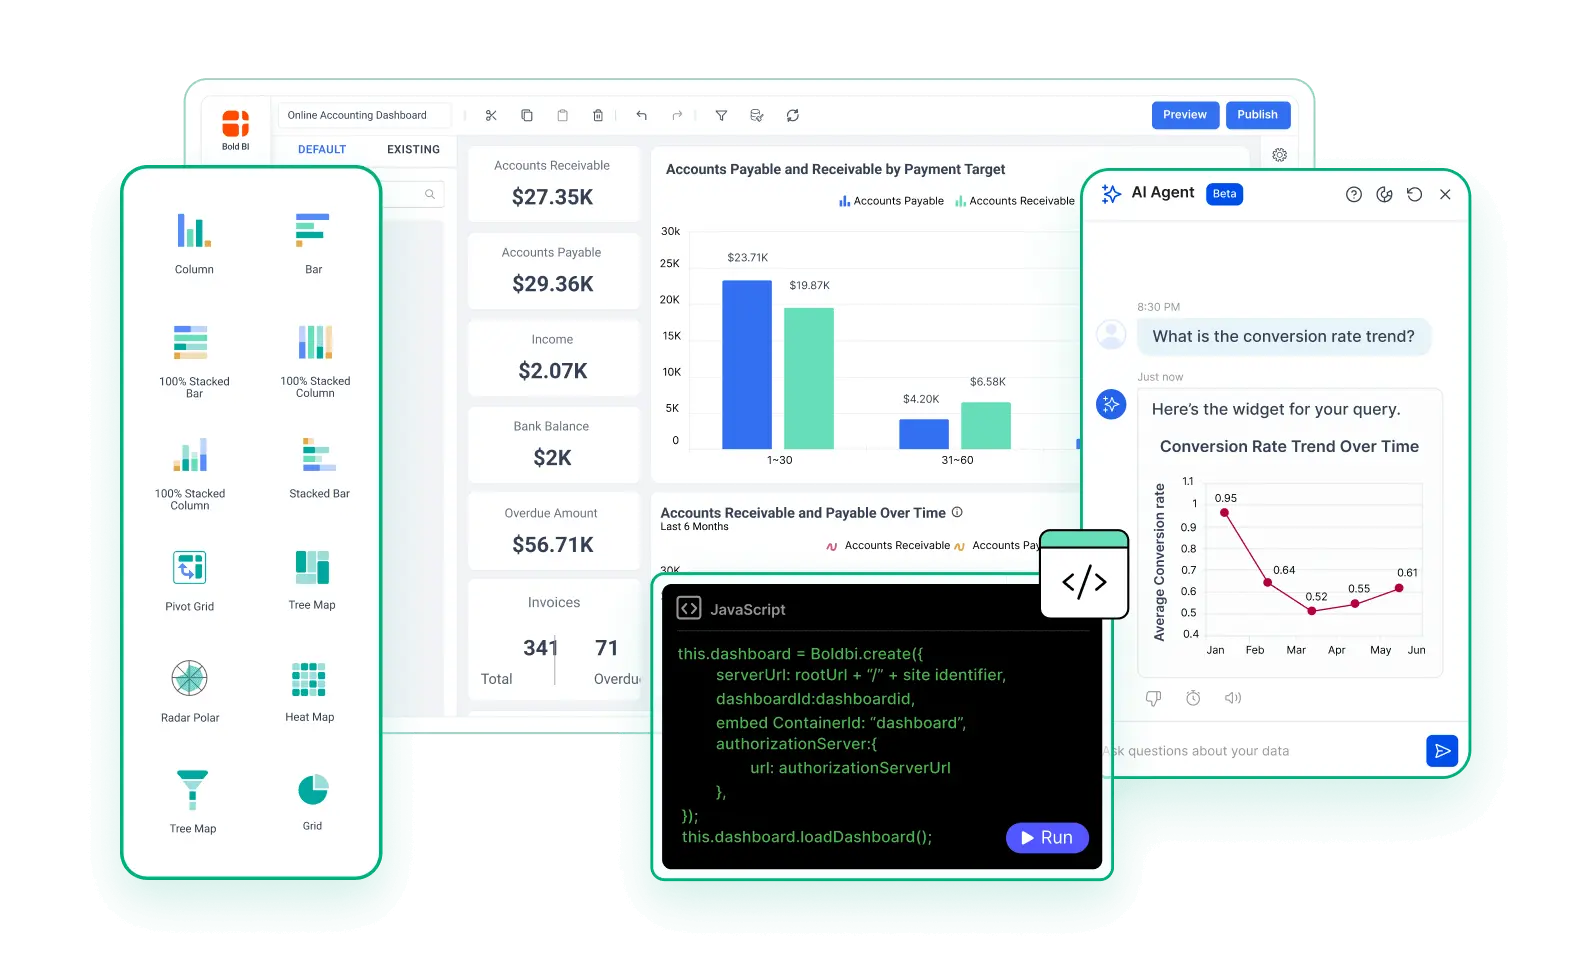
Bold BI connects to 140+ data sources — spreadsheets, SQL databases, REST APIs, Salesforce, cloud storage — and turns them into interactive dashboards with 40+ visualization types. Business users build reports with drag-and-drop; developers can embed the same analytics engine into an internal tool via SDK when they need to. No separate BI stack, no per-seat bill that grows every time you add a viewer. The handoff disappears — the data gets looked at while it's still useful.
-
One connection, every dashboard downstream stays live
-
Drag-and-drop for business users, SDK for developers
-
Application-based pricing — viewers don't move the bill
Four things that make it work in practice
Pick a capability to see it in the product.
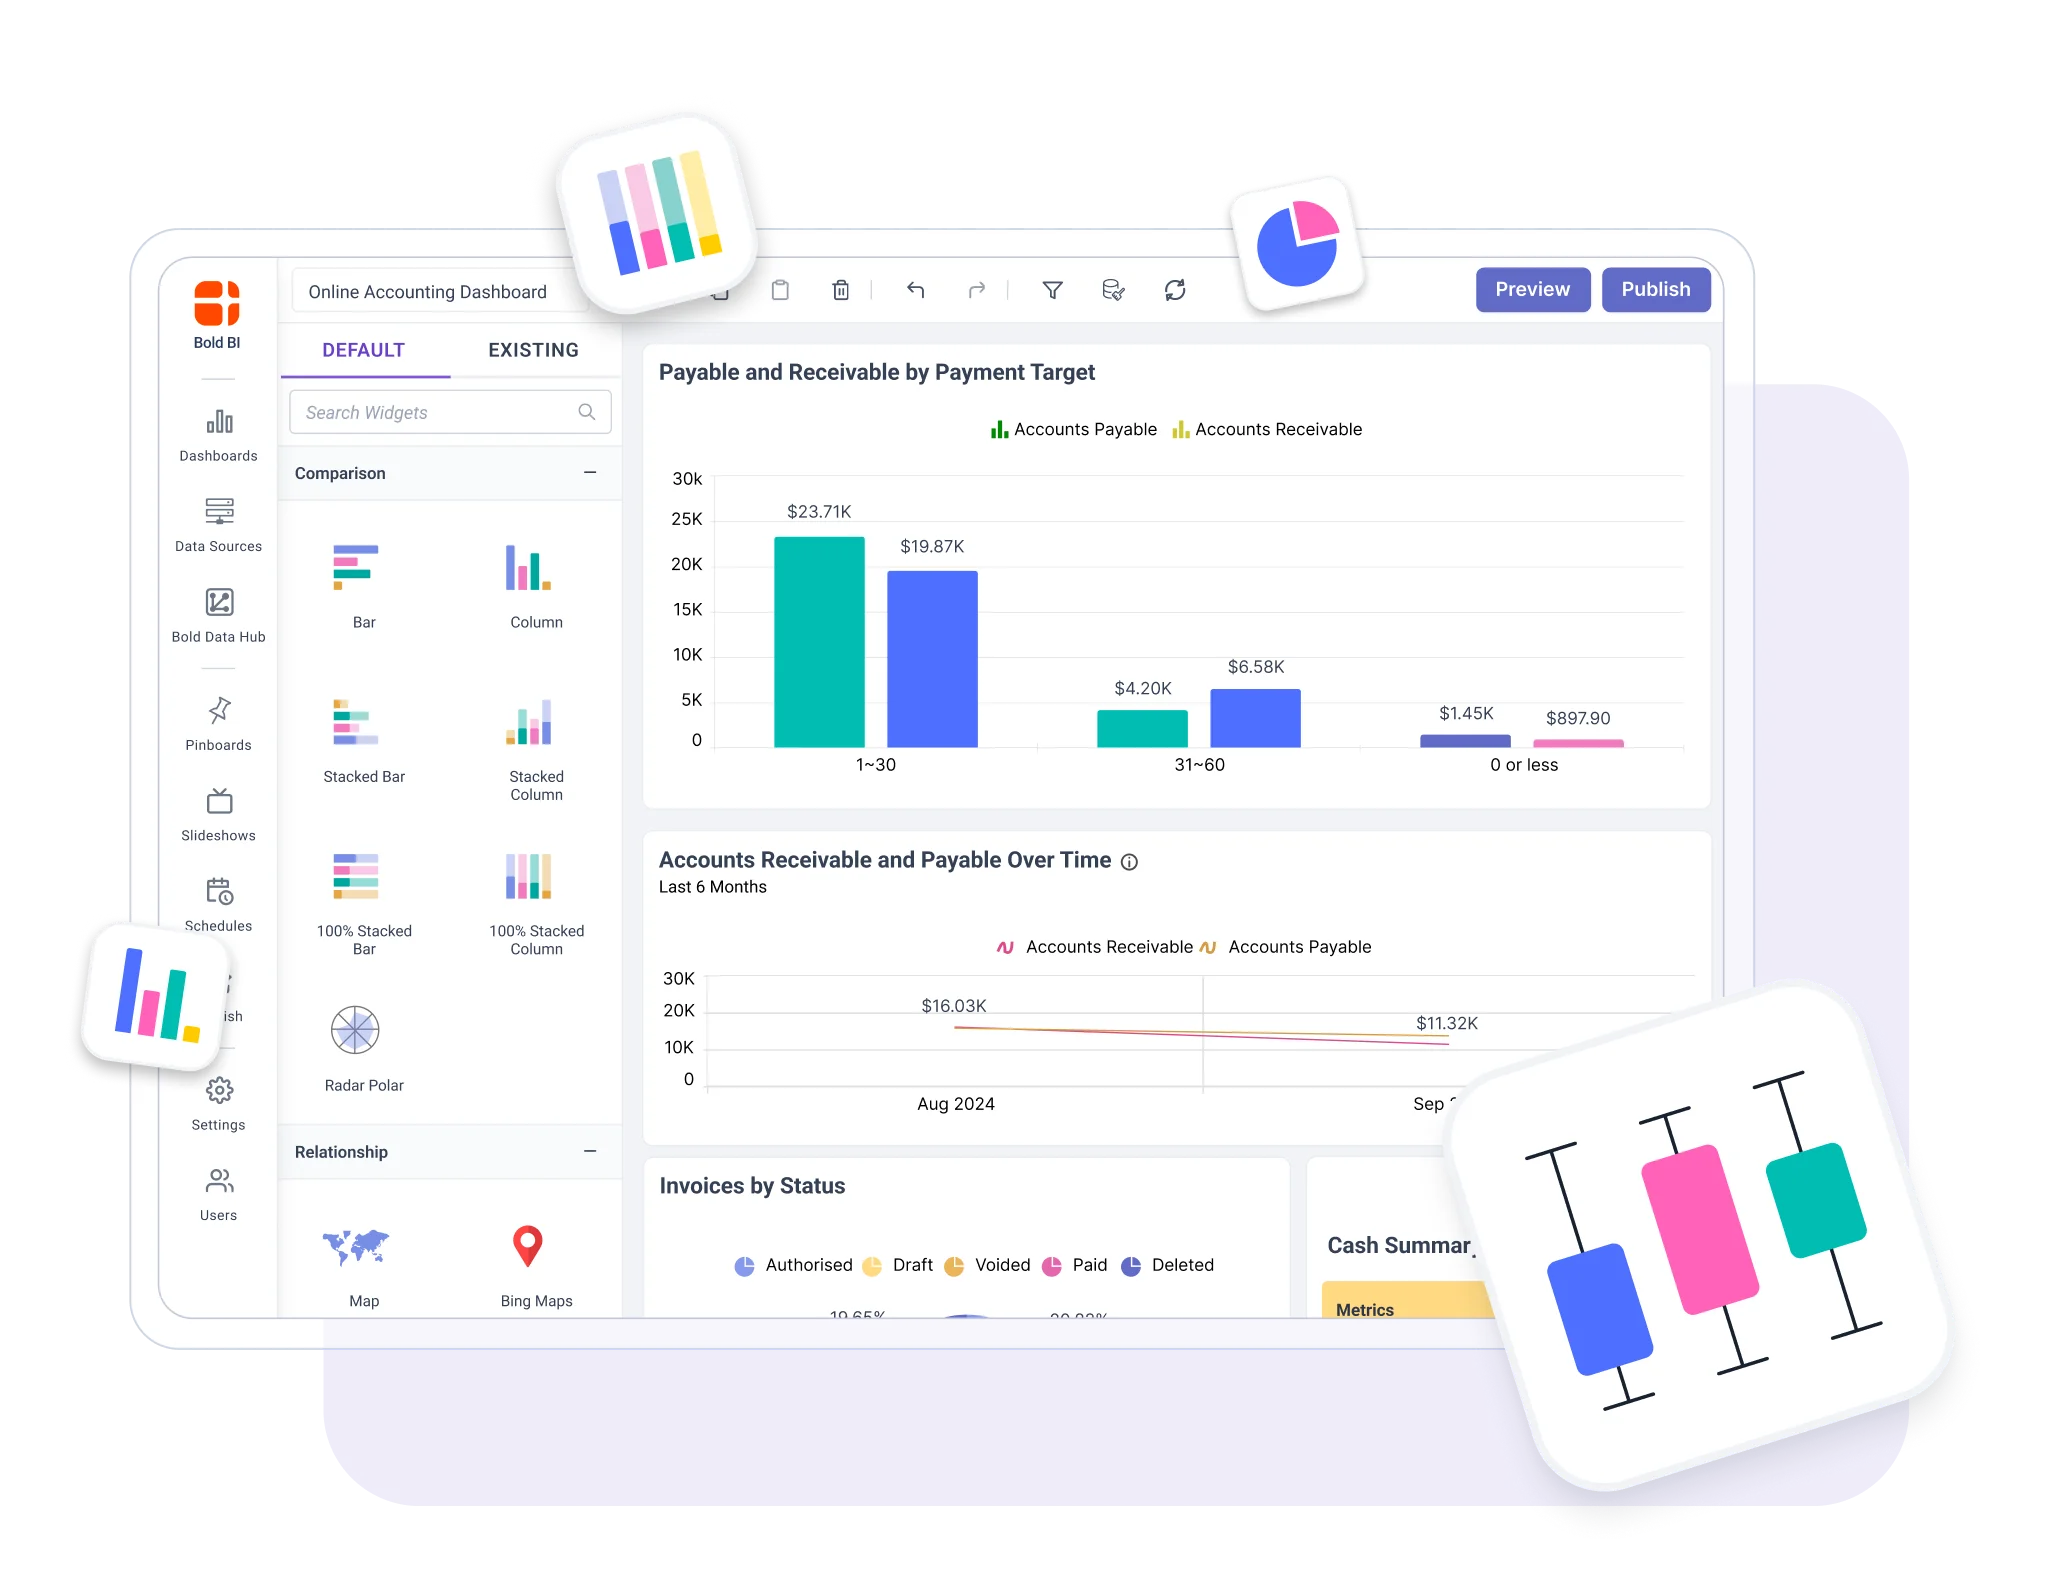
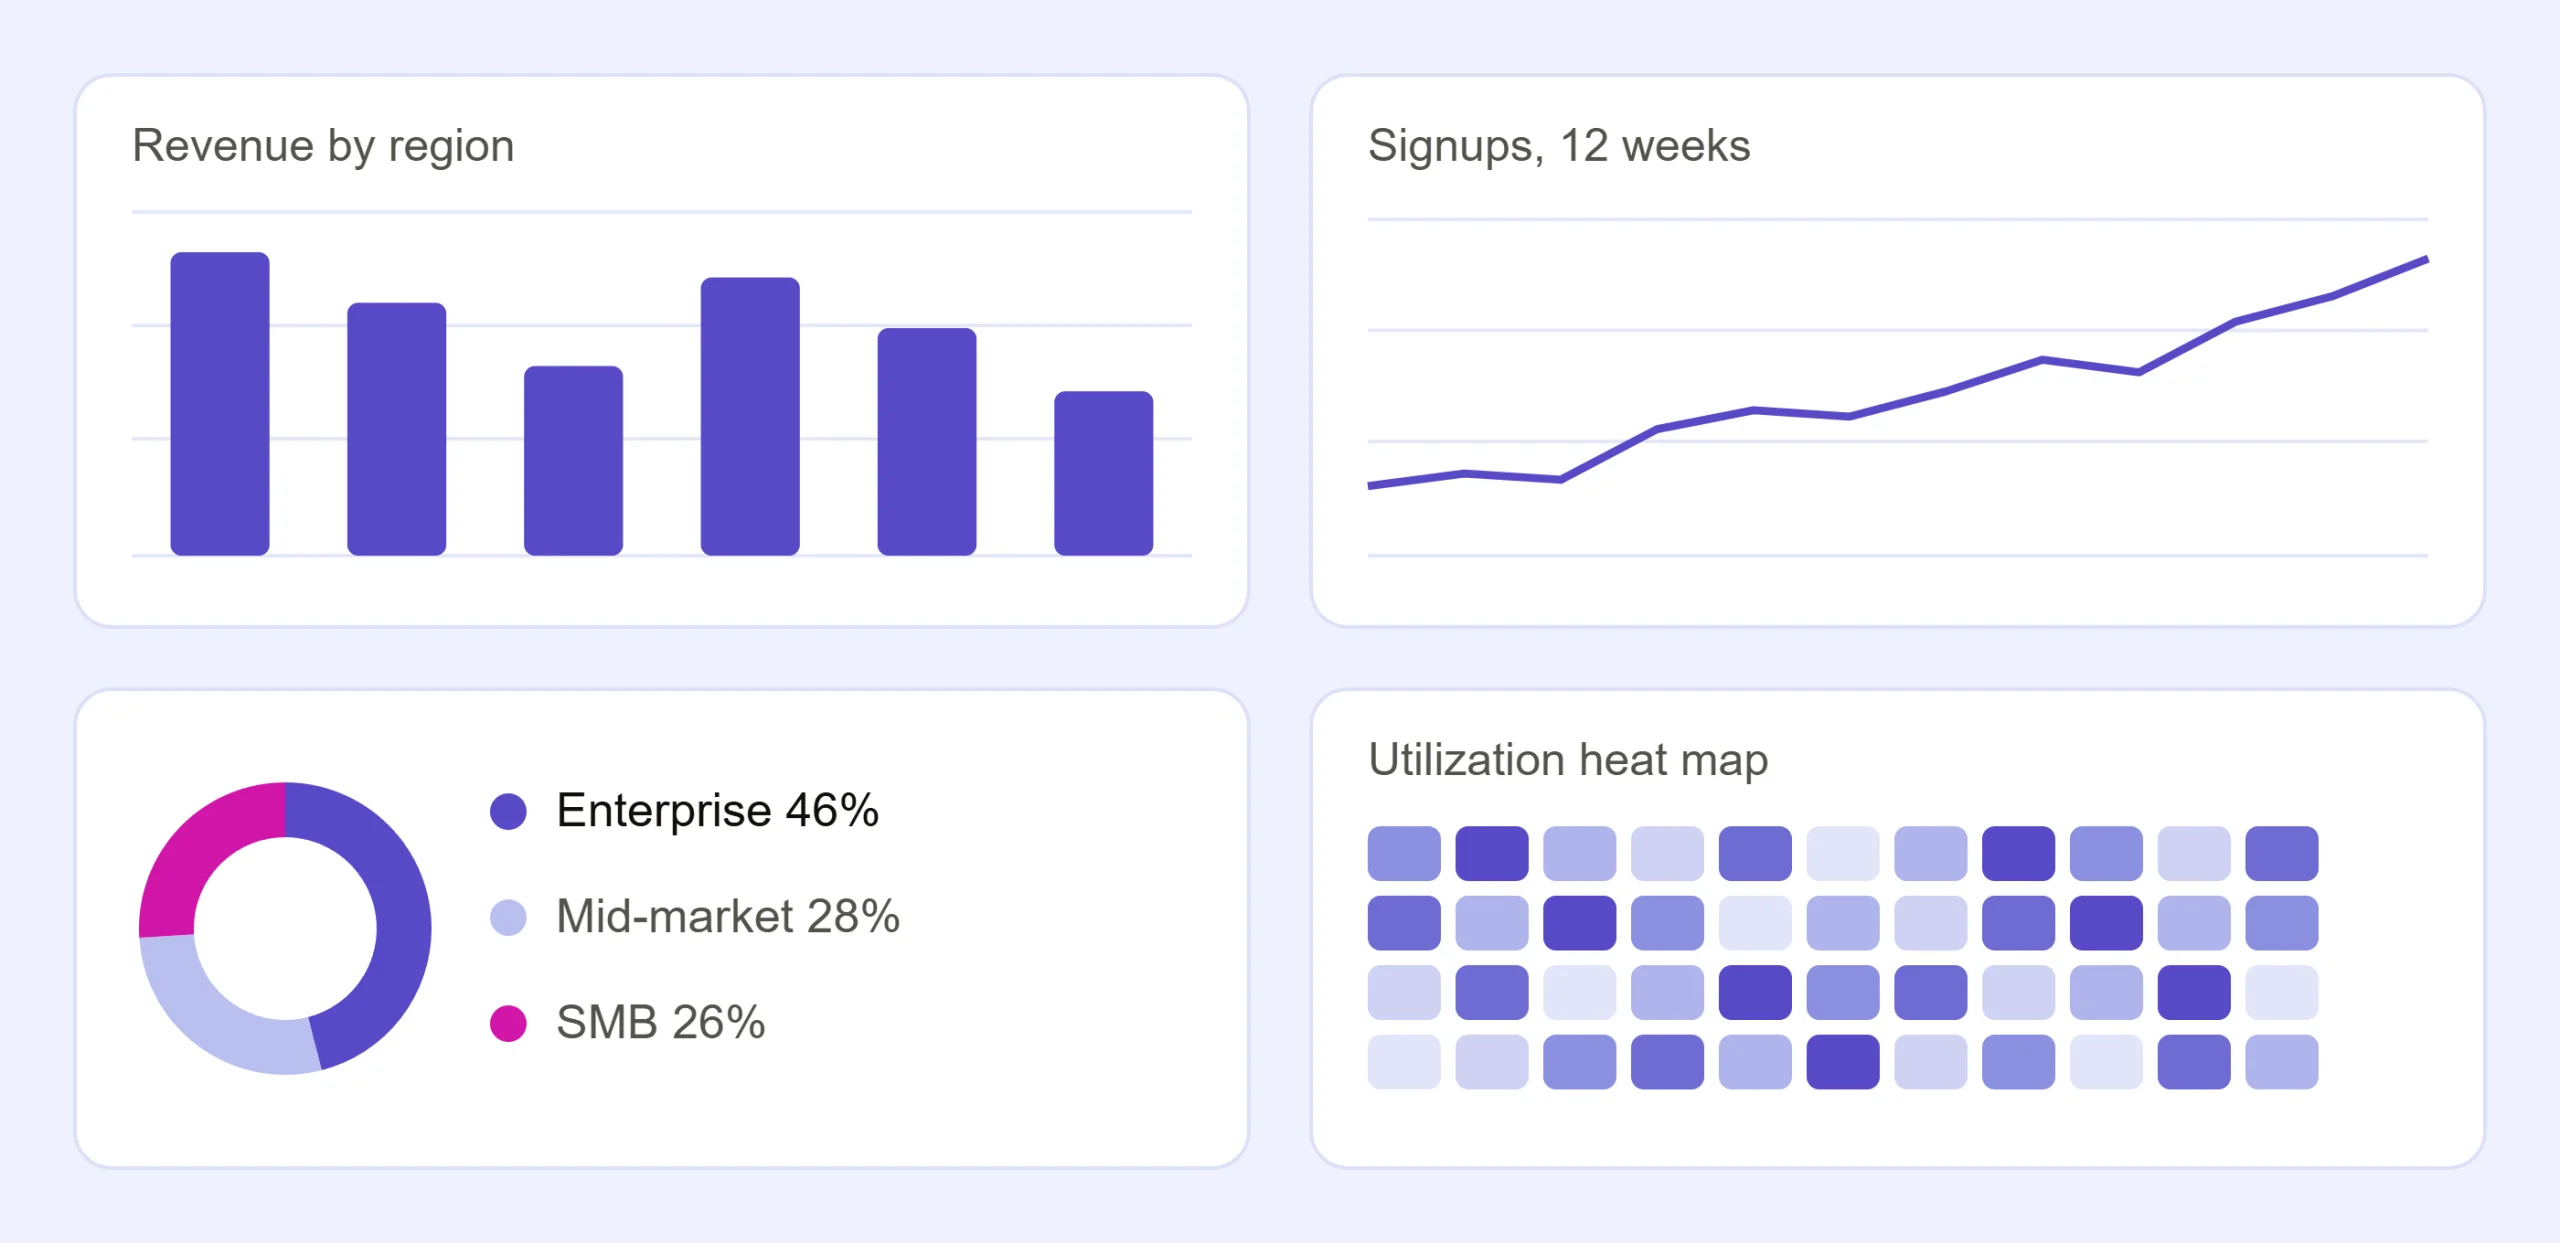
Choose from 40+ chart, map, and widget types — from standard bar and line charts to gauges, heat maps, and geo maps — and customize colors, drill-downs, and filters without touching code. Reviewers consistently cite Bold BI's visualization as intuitive for technical and non-technical users alike: a dashboard nobody can read doesn't get used.
-
Drag-and-drop chart builder — no SQL required for a first working visual
-
Drill-down and cross-filtering, so one dashboard answers the follow-up too
-
Fully themeable to match your brand, down to fonts and color palette
Bold BI connects to 140+ sources out of the box — SQL and NoSQL databases, REST APIs, cloud storage, and business apps like Salesforce — so teams stop stitching together exports from five systems to answer one question. Connect once, and every dashboard built on that source stays live.
-
140+ pre-built connectors — spreadsheets, databases, cloud apps, custom REST APIs
-
One source of truth instead of parallel spreadsheets quietly going out of sync
-
Cloud or your own infrastructure (Docker, Kubernetes, on-premises) — same feature set
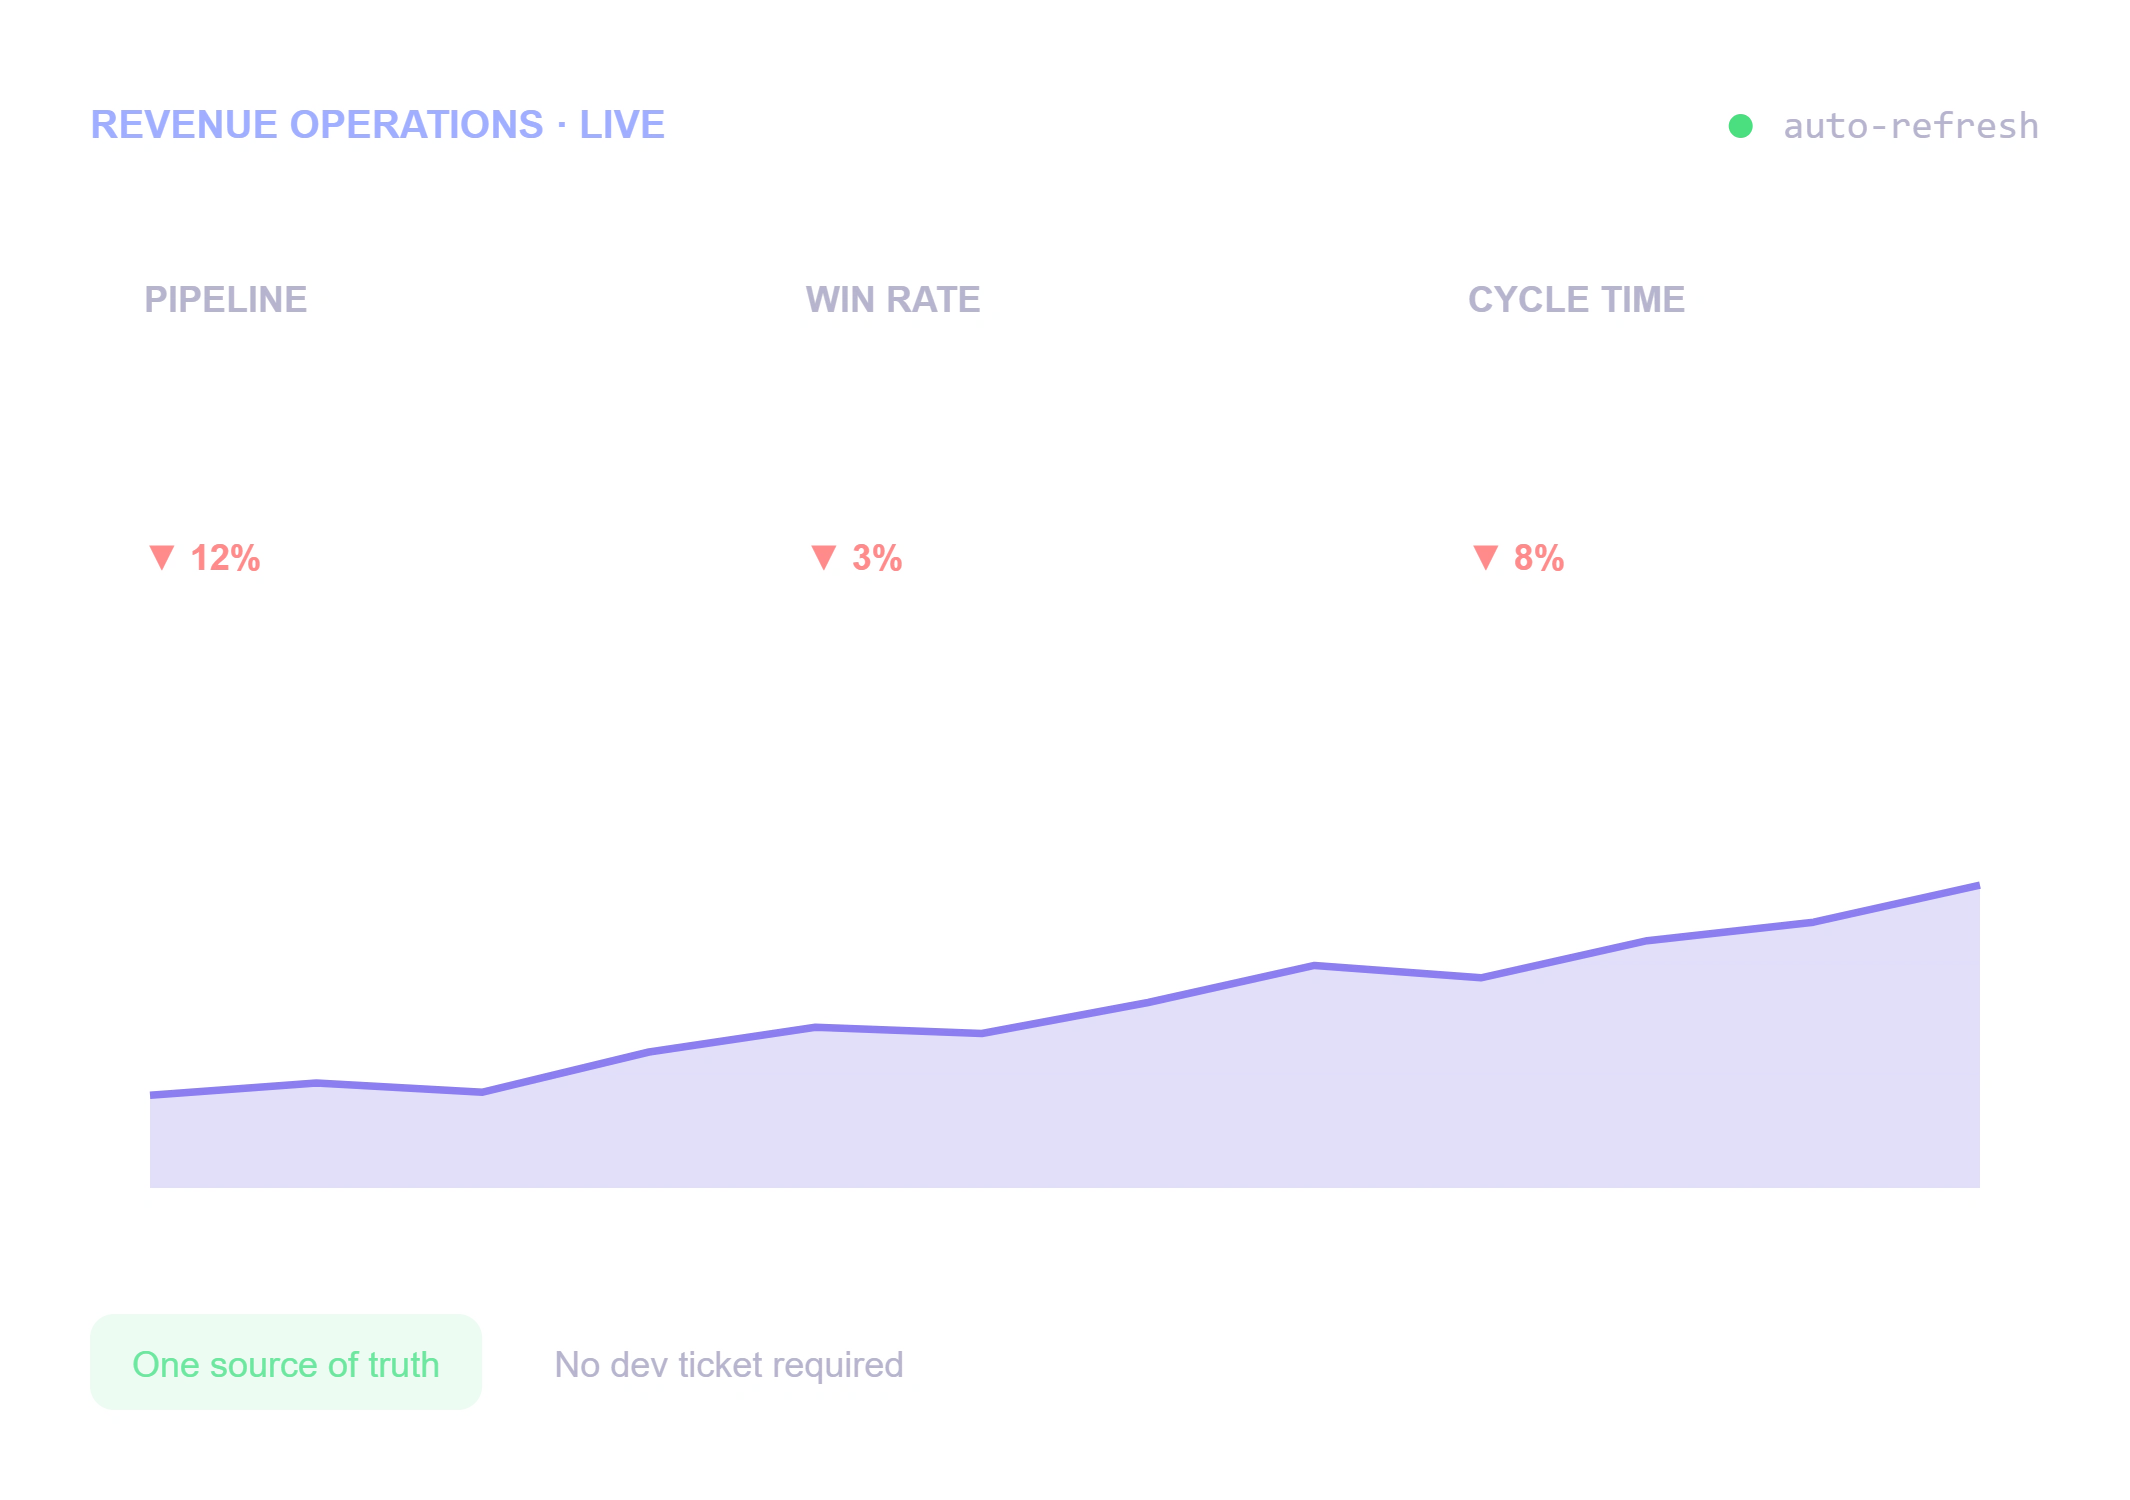
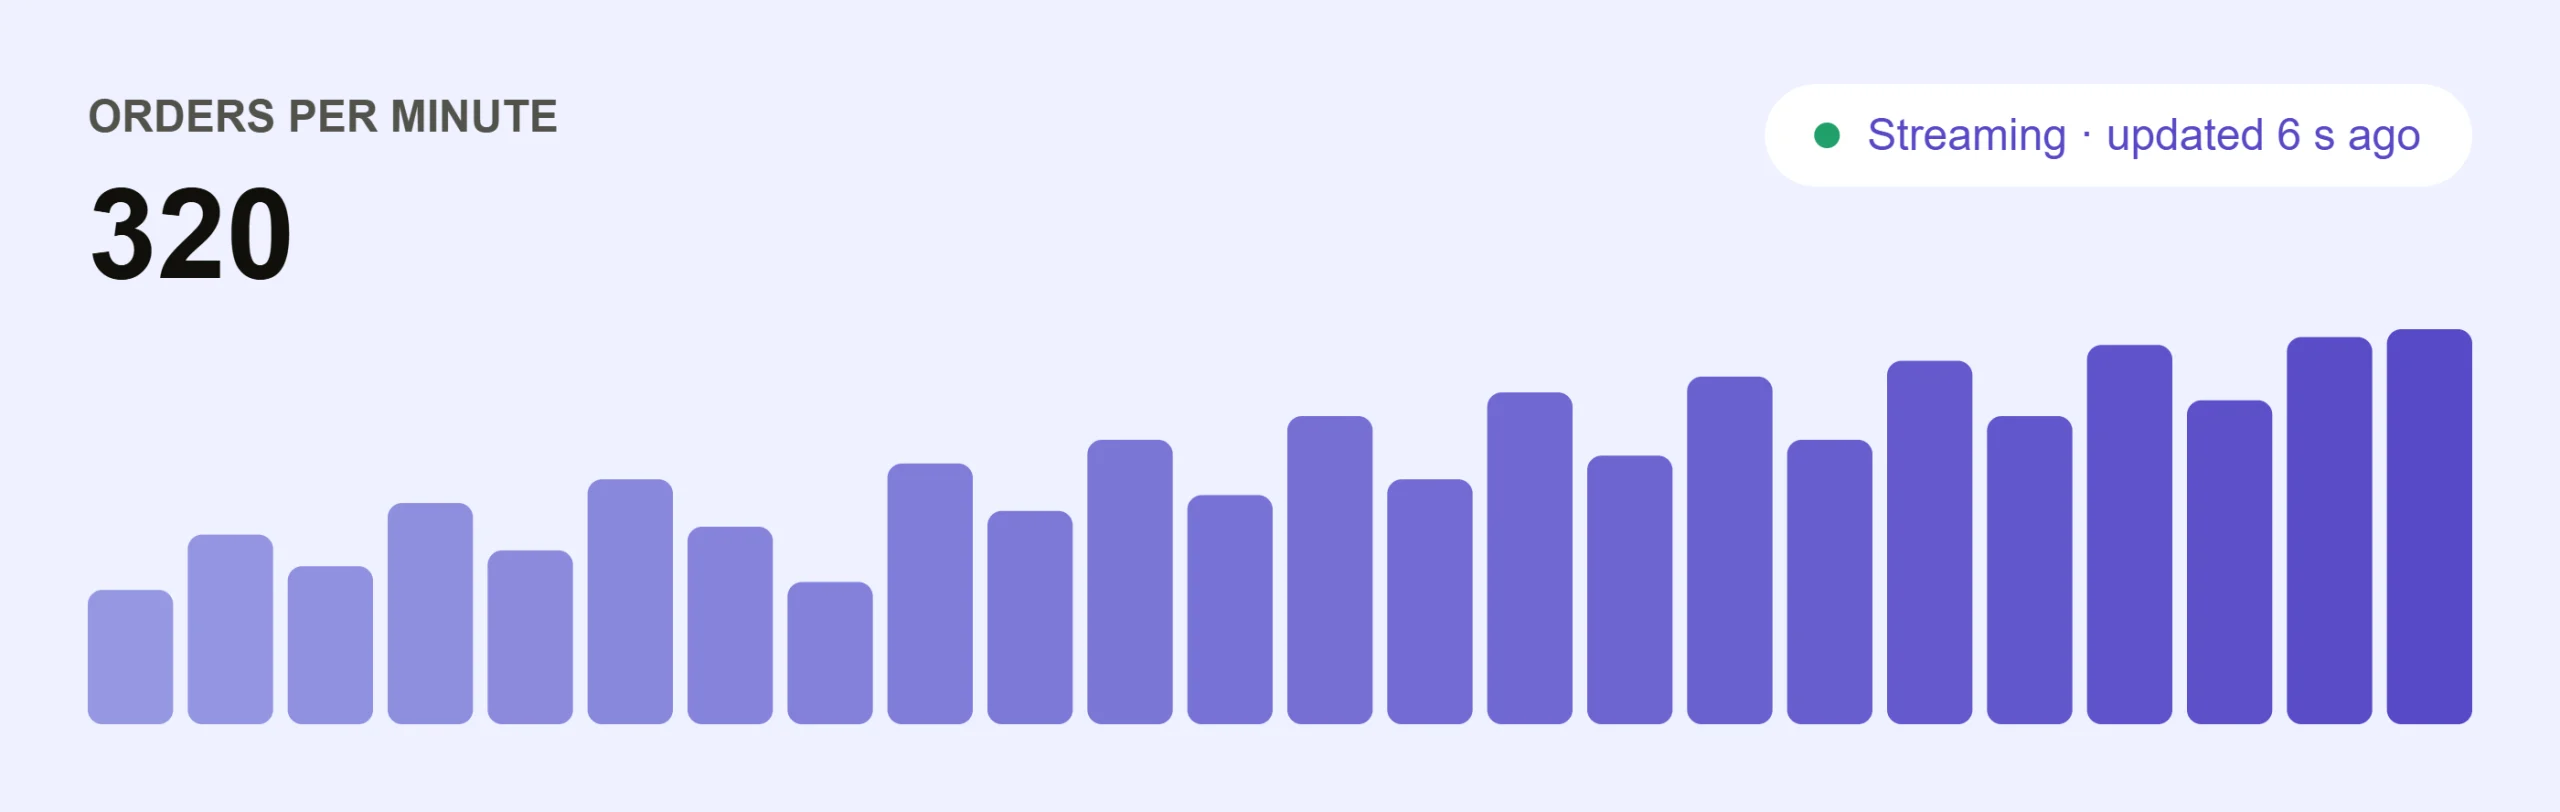
Dashboards refresh automatically as underlying data changes, so operations and sales teams look at the current state of the business instead of last Monday's export. Set the refresh cadence per dashboard — live streaming views for ops monitoring, scheduled refreshes for exec summaries.
-
Live data refresh — no manual re-export, no "is this the latest version?"
-
Role-based dashboards so each team sees its own metrics, updated automatically
-
Works for a single live ops screen or a finance team's daily-refresh KPI view
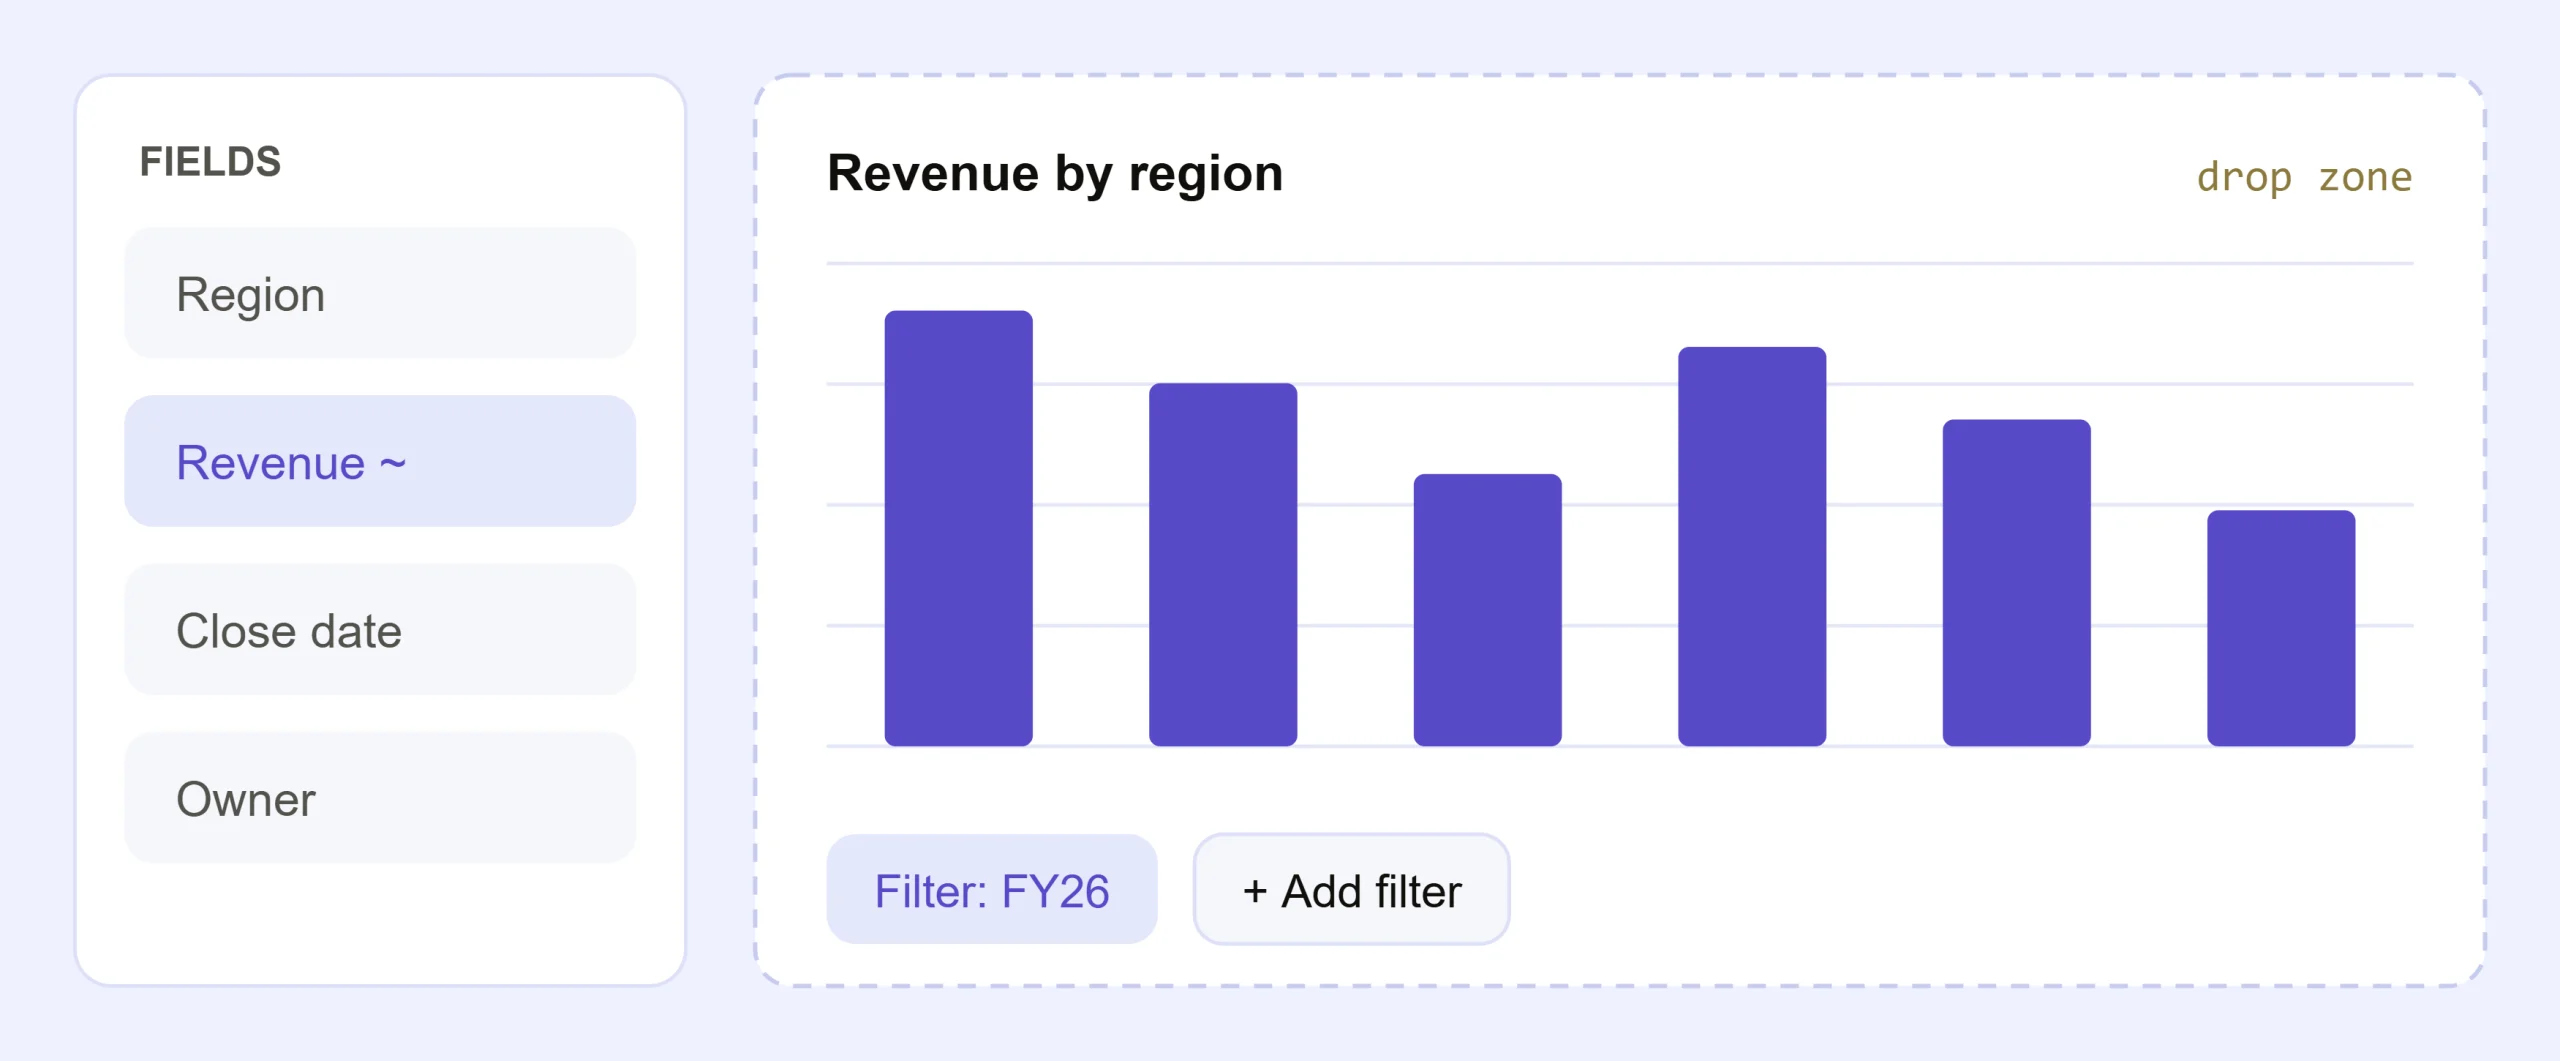
Business users build their own dashboards with a drag-and-drop designer — no SQL, no data modeling, no ticket in the dev backlog. As one reviewer put it: "non-technical people can easily report on data in minutes." IT stays in control of data access and security; everyone else stops waiting on IT for a new chart.
-
Drag-and-drop designer — build a working dashboard without writing a query
-
Role-based and row-level security, so self-service isn't unrestricted access
-
Shared dashboard templates so teams aren't rebuilding the same report
Ask a question in plain English. Get a dashboard, not a ticket.
Type a question — "show me revenue by region for Q3" — and get a working visualization back, no data modeling required. Smart Narrations summarize what a dashboard is actually showing, so a busy executive gets the takeaway without hunting through charts.
-
Natural-language queries — no SQL or DAX required
-
Prompt-to-dashboard — describe it, get a complete interactive dashboard
-
Included in every plan, never billed per prompt
-
BYOK for OpenAI, Azure OpenAI or Anthropic — your governance, your billing
Which products are churning?
Churned accounts
46
Highest-risk SKU
Field Kit
Net retention
104%
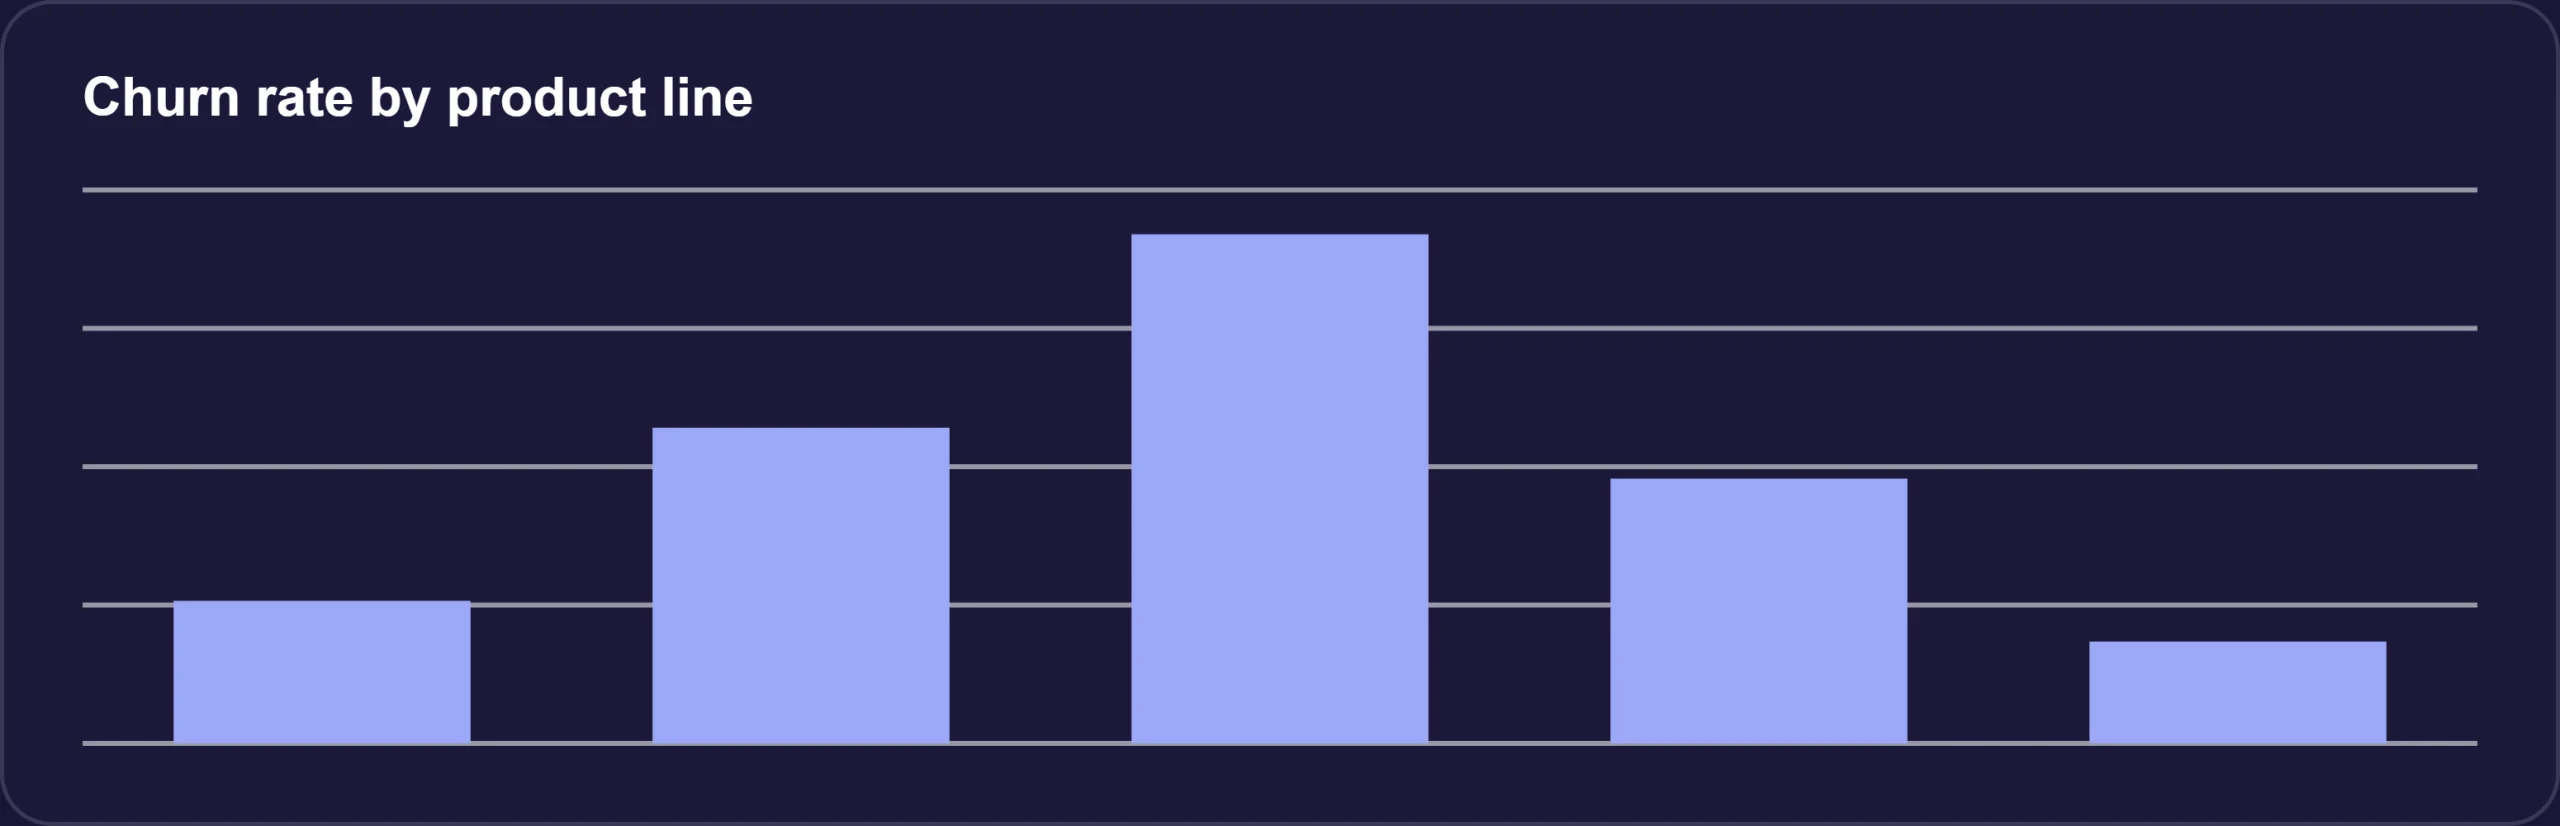
Field Kit churn doubled after the March pricing change; three of five product lines improved retention quarter over quarter.
Three steps. No BI team required.
Connect your data, build with drag-and-drop or AI, then share or embed — live in minutes, not sprints.
Connect your data
Link any of 140+ sources: databases, spreadsheets, cloud apps, or a custom API. Takes minutes, not a data-engineering project.
Build or ask
Drag and drop your own dashboard, or type what you want in plain English and let AI build the first draft.
Share and monitor
Publish role-based dashboards to your team, or embed the same analytics inside your own product — live refresh built in.
One platform, every function
Different roles ask different questions of the same data. Bold BI gives each of them a dashboard built for their job, not a generic report everyone has to interpret themselves.

Business executives
A single real-time view across departments, without waiting for someone to compile it.

BI & analytics teams
Standardize how dashboards get built and governed, without every request routing through a data team of one.

Operations managers
Live operational dashboards to catch bottlenecks while they're still fixable, not in next week's report.

Finance leaders
Automated, always-current financial dashboards that replace manual spreadsheet consolidation.

Sales & marketing
Pipeline and campaign performance in real time, filterable by rep, region, or channel.

Enterprise data analysts
Fast prototyping of new visualizations without provisioning a separate BI tool for every request.
Real teams, real dashboards
Real feedback from G2 reviewers on connecting data, embedding, and support that doesn't cost extra.
"What we liked best was the ability to connect to on-prem data sources, easy connectors, embedding visualizations, and a reasonable cost."
SD
Samuel Davidson
Application Development Manager · via G2
"White-labeling and SSO (OAuth/SAML) made the UX feel truly 'ours,' and support has been responsive when we needed help."
PH
Pedro Hernandez
Peopleworks · via G2
Application-based pricing. No per-user surprises.
Most BI tools charge per user or per query, so your bill climbs every time you add a viewer or run another report. Bold BI prices by application instead — add internal users or embed for more customers without recalculating your budget every quarter.
30-day free trial
Full feature access, no credit card, no artificial caps to force an upgrade.
No per-user fees
Priced by application — viewers and team members don't move the bill.
Money-back guarantee
30 days after purchase, no questions about whether you used it enough.
Answers before you start a trial
Bold BI includes 140+ pre-built connectors, covering SQL and NoSQL databases, REST APIs, cloud storage, and business applications like Salesforce.
No. Business users build dashboards with a drag-and-drop designer or by typing a request in plain English through the AI Assistant. Developers are only needed if you're embedding the analytics inside your own application.
Bold BI uses application-based pricing rather than per-user licensing, so cost doesn't scale with every new viewer or team member added.
Yes — 30 days, full feature access, no credit card required. There's also a 30-day money-back guarantee after purchase.
Yes. Bold BI runs in the cloud or self-hosted (Docker, Kubernetes, on-premises), with the same full feature set either way.
Type a question or request in plain language and the AI Assistant returns a visualization or a full dashboard. It supports bring-your-own-key (BYOK) for OpenAI, Azure OpenAI, or Anthropic, so AI usage stays under your own governance.
See your own data in a dashboard today
Connect your first data source and build a working dashboard before your coffee gets cold. No credit card, no sales call required to start — just a 30-day free trial with full feature access.
Data visualization platform built for business teams
Connect your data, build interactive dashboards, and see what's happening in your business in real time — without writing a query or filing an IT ticket.
No credit card required
Syscon
NetWorxc
A4B
DigiQuip
CarNow
Revver
Smartway2
GeniusVets
Talentegy
4.4/5
Average rating on G2 — 91 reviews
4.9/5
On Capterra, GetApp and Software Advice
140+
Data connectors, 40+ visualization types
G2 Leader
Fall 2025 · Top 50 Analytics Product (#29) · Easiest Admin
Your data isn't the problem. Getting it into a dashboard is.
One connection powers every dashboard downstream — drag-and-drop for business users, SDK for developers, no per-seat bill.
Most teams don't lack data — they lack a fast way to see it. Numbers sit scattered across spreadsheets, CRMs, and internal systems. Every new chart means exporting a CSV, pinging a developer, or waiting on whoever owns the "reporting tool." By the time a dashboard is ready, the decision it was supposed to inform has already been made without it.
-
One connection, every dashboard downstream stays live
-
Drag-and-drop for business users, SDK for developers
-
Application-based pricing — viewers don't move the bill
Bold BI connects to 140+ data sources — spreadsheets, SQL databases, REST APIs, Salesforce, cloud storage — and turns them into interactive dashboards with 40+ visualization types. Business users build reports with drag-and-drop; developers can embed the same analytics engine into an internal tool via SDK when they need to. No separate BI stack, no per-seat bill that grows every time you add a viewer. The handoff disappears — the data gets looked at while it's still useful.
-
One connection, every dashboard downstream stays live
-
Drag-and-drop for business users, SDK for developers
-
Application-based pricing — viewers don't move the bill
Four things that make it work in practice
Pick a capability to see it in the product.
Choose from 40+ chart, map, and widget types — from standard bar and line charts to gauges, heat maps, and geo maps — and customize colors, drill-downs, and filters without touching code. Reviewers consistently cite Bold BI's visualization as intuitive for technical and non-technical users alike: a dashboard nobody can read doesn't get used.
-
Drag-and-drop chart builder — no SQL required for a first working visual
-
Drill-down and cross-filtering, so one dashboard answers the follow-up too
-
Fully themeable to match your brand, down to fonts and color palette
Bold BI connects to 140+ sources out of the box — SQL and NoSQL databases, REST APIs, cloud storage, and business apps like Salesforce — so teams stop stitching together exports from five systems to answer one question. Connect once, and every dashboard built on that source stays live.
-
140+ pre-built connectors — spreadsheets, databases, cloud apps, custom REST APIs
-
One source of truth instead of parallel spreadsheets quietly going out of sync
-
Cloud or your own infrastructure (Docker, Kubernetes, on-premises) — same feature set
Dashboards refresh automatically as underlying data changes, so operations and sales teams look at the current state of the business instead of last Monday's export. Set the refresh cadence per dashboard — live streaming views for ops monitoring, scheduled refreshes for exec summaries.
-
Live data refresh — no manual re-export, no "is this the latest version?"
-
Role-based dashboards so each team sees its own metrics, updated automatically
-
Works for a single live ops screen or a finance team's daily-refresh KPI view
Business users build their own dashboards with a drag-and-drop designer — no SQL, no data modeling, no ticket in the dev backlog. As one reviewer put it: "non-technical people can easily report on data in minutes." IT stays in control of data access and security; everyone else stops waiting on IT for a new chart.
-
Drag-and-drop designer — build a working dashboard without writing a query
-
Role-based and row-level security, so self-service isn't unrestricted access
-
Shared dashboard templates so teams aren't rebuilding the same report
Ask a question in plain English. Get a dashboard, not a ticket.
Type a question — "show me revenue by region for Q3" — and get a working visualization back, no data modeling required. Smart Narrations summarize what a dashboard is actually showing, so a busy executive gets the takeaway without hunting through charts.
-
Natural-language queries — no SQL or DAX required
-
Prompt-to-dashboard — describe it, get a complete interactive dashboard
-
Included in every plan, never billed per prompt
-
BYOK for OpenAI, Azure OpenAI or Anthropic — your governance, your billing
Which products are churning?
Churned accounts
46
Highest-risk SKU
Field Kit
Net retention
104%
Field Kit churn doubled after the March pricing change; three of five product lines improved retention quarter over quarter.
Three steps. No BI team required.
Connect your data, build with drag-and-drop or AI, then share or embed — live in minutes, not sprints.
Connect your data
Link any of 140+ sources: databases, spreadsheets, cloud apps, or a custom API. Takes minutes, not a data-engineering project.
Build or ask
Drag and drop your own dashboard, or type what you want in plain English and let AI build the first draft.
Share and monitor
Publish role-based dashboards to your team, or embed the same analytics inside your own product — live refresh built in.
One platform, every function
Different roles ask different questions of the same data. Bold BI gives each of them a dashboard built for their job, not a generic report everyone has to interpret themselves.
Business executives
A single real-time view across departments, without waiting for someone to compile it.
BI & analytics teams
Standardize how dashboards get built and governed, without every request routing through a data team of one.
Operations managers
Live operational dashboards to catch bottlenecks while they're still fixable, not in next week's report.
Finance leaders
Automated, always-current financial dashboards that replace manual spreadsheet consolidation.
Sales & marketing
Pipeline and campaign performance in real time, filterable by rep, region, or channel.
Enterprise data analysts
Fast prototyping of new visualizations without provisioning a separate BI tool for every request.
Real teams, real dashboards
Real feedback from G2 reviewers on connecting data, embedding, and support that doesn't cost extra.
"What we liked best was the ability to connect to on-prem data sources, easy connectors, embedding visualizations, and a reasonable cost."
SD
Samuel Davidson
Application Development Manager · via G2
"White-labeling and SSO (OAuth/SAML) made the UX feel truly 'ours,' and support has been responsive when we needed help."
PH
Pedro Hernandez
Peopleworks · via G2
Application-based pricing. No per-user surprises.
Most BI tools charge per user or per query, so your bill climbs every time you add a viewer or run another report. Bold BI prices by application instead — add internal users or embed for more customers without recalculating your budget every quarter.
30-day free trial
Full feature access, no credit card, no artificial caps to force an upgrade.
No per-user fees
Priced by application — viewers and team members don't move the bill.
Money-back guarantee
30 days after purchase, no questions about whether you used it enough.
Answers before you start a trial
Bold BI includes 140+ pre-built connectors, covering SQL and NoSQL databases, REST APIs, cloud storage, and business applications like Salesforce.
No. Business users build dashboards with a drag-and-drop designer or by typing a request in plain English through the AI Assistant. Developers are only needed if you're embedding the analytics inside your own application.
Bold BI uses application-based pricing rather than per-user licensing, so cost doesn't scale with every new viewer or team member added.
Yes — 30 days, full feature access, no credit card required. There's also a 30-day money-back guarantee after purchase.
Yes. Bold BI runs in the cloud or self-hosted (Docker, Kubernetes, on-premises), with the same full feature set either way.
Type a question or request in plain language and the AI Assistant returns a visualization or a full dashboard. It supports bring-your-own-key (BYOK) for OpenAI, Azure OpenAI, or Anthropic, so AI usage stays under your own governance.
See your own data in a dashboard today
Connect your first data source and build a working dashboard before your coffee gets cold. No credit card, no sales call required to start — just a 30-day free trial with full feature access.