
Build Business Dashboards Without Waiting on IT or a Dev Sprint
Bold BI is dashboard software business users can build themselves with drag-and-drop — and developers can fully embed and white-label into their own app when self-service isn't enough. Connect 140+ data sources and go live with real-time, interactive dashboards in days, not quarters.
No credit card required · 30-day free trial · 4.4/5 on G2 (91 reviews)
Syscon
NetWorxc
A4B
DigiQuip
CarNow
Revver
Smartway2
GeniusVets
Talentegy
Still Copying Numbers Between Spreadsheets to Get One Report Out?
The same bottleneck shows up differently depending on which side of the business you sit on.
Your ops lead pulls sales from Salesforce, spend from another tool, tickets from a third — then spends Tuesday VLOOKUP-ing them together for Wednesday's meeting. By Thursday, it's stale. Ask for a new cut and it's "let me get back to you."
A prospect asks if your product has built-in reporting. You say "it's on the roadmap." They pick the competitor who already shipped one. Once you add BI, per-seat pricing from Power BI or Tableau makes the bill climb with every new user or customer.
Bold BI removes both bottlenecks at once: business users build their own dashboards without a ticket to IT, and developers embed the whole thing into their product without months of build time.
Four Things That Make Bold BI Different
Built for the two people who actually touch a dashboard: the business user who builds it, and the developer who ships it.

A Drag-and-Drop Designer Business Users Actually Use
Build dashboards by dragging fields onto a canvas — no SQL, no scripting, no waiting on a developer to change a chart.
Your ops manager drags "Ticket Volume" and "Resolution Time" onto a canvas, filters by team, and has a working dashboard before her coffee's cold — no ticket to IT, no sprint planning meeting.

Connect to Where Your Data Already Lives
140+ ready-made data connectors and 40+ visualization types mean you're not writing custom integrations before you can build a single dashboard.
Your data's split across a Postgres database, Salesforce, and a folder of CSVs someone still emails around every Monday. Connect all three in the same afternoon, without a custom integration for any of them.

Deep Embedding, Not a Bolted-On iframe
The full dashboard designer — not just the finished chart — embeds and white-labels into your own product via SDKs for React, Angular, Vue, Blazor, and .NET, plus REST APIs.
Your SaaS product already has a Settings tab and a Billing tab. Add an Analytics tab that looks like it was built in-house — because it's your SDK call rendering it, not an iframe pointing at someone else's domain.

Real-Time Analytics That Scales Without Punishing Growth
Dashboards update in real time, with interactive drill-downs and role-based, row-level security built in. Pricing is application-based, not per-user.
You roll dashboards out to 40 internal users this quarter, then to all 300 customers on your Enterprise plan next quarter. Your BI bill doesn't jump 7x just because your customer list did — unlike per-seat licensing.
Ask Your Data a Question. Get a Dashboard Back.
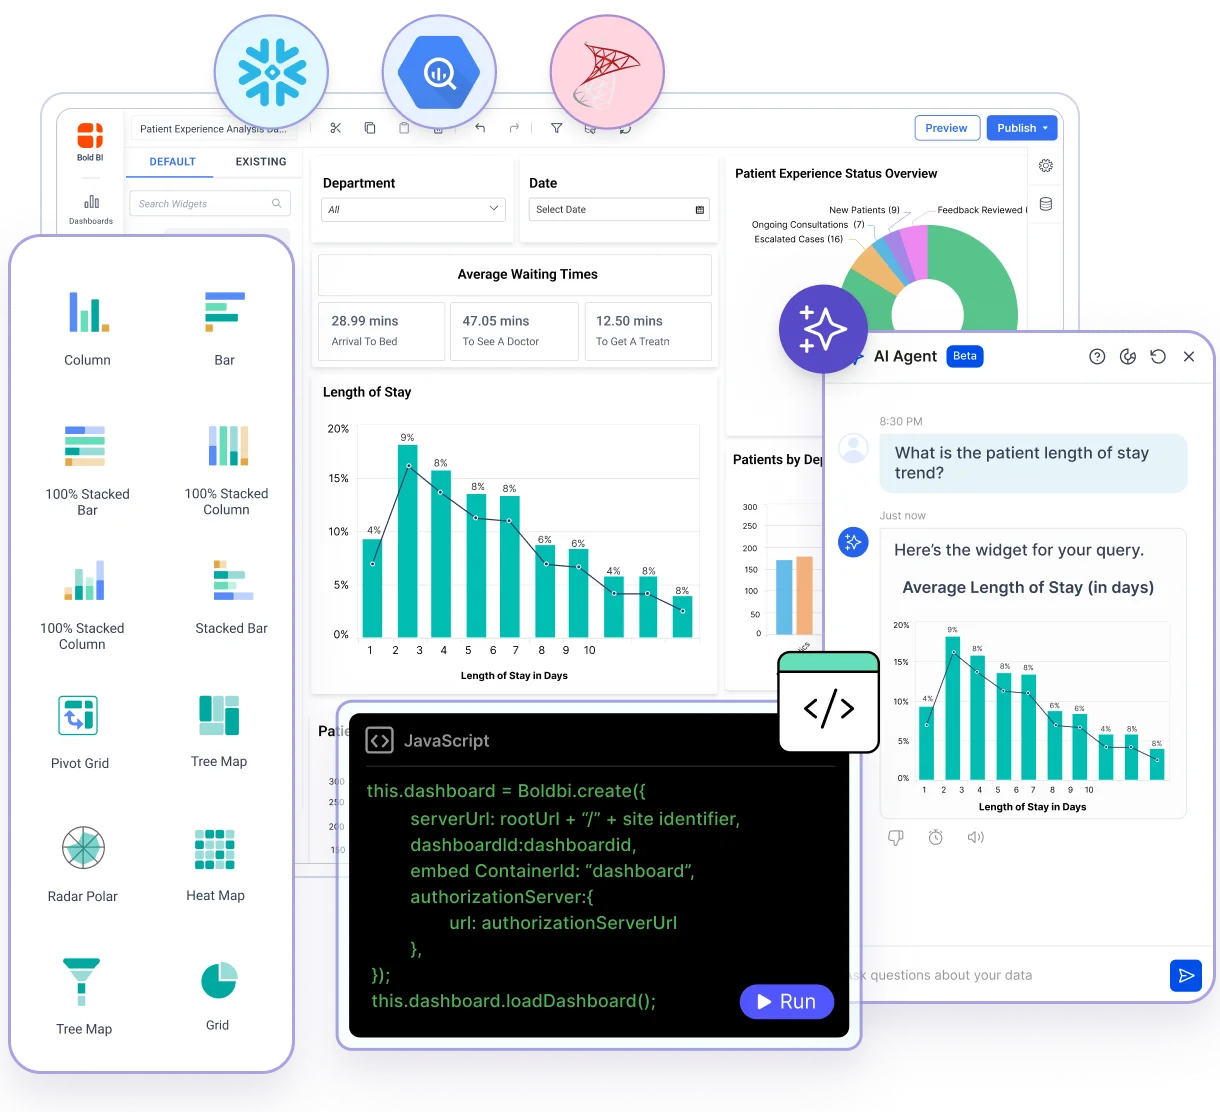
Type a question and Bold BI builds the chart — you don't need to know which table the data lives in or how it joins. Get a written summary next to the chart, not just numbers to interpret yourself. Use your own OpenAI or Azure OpenAI key (BYOK) so you control cost and data handling.
A regional manager who's never opened a dashboard designer types one sentence and has a chart on screen in seconds. A developer embedding Bold BI gets the same prompt-to-dashboard box inside their own product, on day one.

Live in Three Steps
No lengthy onboarding, no professional-services engagement — connect, build or embed, and publish.
Connect
Point Bold BI at your data — 140+ connectors cover databases, cloud apps, spreadsheets, and on-prem sources.
Build or Embed
Business users drag and drop dashboards directly; developers embed the designer itself into their own app via SDK or REST API.
Share, Securely
Publish with role-based and row-level security, SSO (OAuth/SAML), and white-labeled branding — so every user sees only what they should.
What Teams Say After Switching
Three teams, three different reasons — connectivity and cost, customization, and embedding with SSO.
"What we liked best was the ability to connect to on-prem data sources, easy connectors, embedding visualizations, and a reasonable cost."
SD
Samuel Davidson
Application Development Manager
"Now I can basically provide anything the customer needs from their dashboard, and I really don't have limitations. I can customize anything."
PH
Pedro Hernandez
Peopleworks
"White-labeling and SSO (OAuth/SAML) made the UX feel truly 'ours,' and support has been responsive when we needed help."
NK
Nirbhay K
G2 review
Before You Start
Straight answers on scale, pricing, setup, and who needs to be involved.
Bold BI is built for fast, self-service and embedded dashboards at small-to-mid scale, not extreme-scale predictive analytics — if you need the deepest possible customization on massive datasets, a tool like Tableau may be a better fit for that specific need. Most teams choosing Bold BI are optimizing for speed, embedding flexibility, and cost, not raw analytical ceiling.
Power BI and Tableau charge per user, which gets expensive fast once you're embedding analytics for hundreds of end customers instead of a handful of internal seats. Bold BI's application-based pricing doesn't scale with headcount the same way.
Most of the friction reviewers mention is in initial configuration, especially in containerized (Docker/Kubernetes) deployments — which is exactly why support is unlimited and free on every plan, not a paid add-on. It's the most-cited praise theme on G2.
No — the drag-and-drop designer is built for non-technical business users. Developers only need to get involved if you're embedding Bold BI directly into your own product.
Build Your First Dashboard Today
Connect your data, drag your first chart onto the canvas, and see why teams switch from spreadsheets — and from per-user BI licensing — to Bold BI.
